pandas.plotting.radviz#
- pandas.plotting.radviz(frame,class_column,ax=None,color=None,colormap=None,**kwds)[source]#
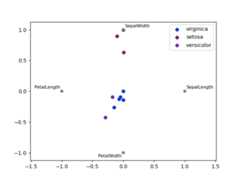
Plot a multidimensional dataset in 2D.
Each Series in the DataFrame is represented as a evenly distributedslice on a circle. Each data point is rendered in the circle according tothe value on each Series. Highly correlatedSeries in theDataFrameare placed closer on the unit circle.
RadViz allow to project a N-dimensional data set into a 2D space where theinfluence of each dimension can be interpreted as a balance between theinfluence of all dimensions.
More info available at theoriginal articledescribing RadViz.
- Parameters:
- frameDataFrame
Object holding the data.
- class_columnstr
Column name containing the name of the data point category.
- ax
matplotlib.axes.Axes, optional A plot instance to which to add the information.
- colorlist[str] or tuple[str], optional
Assign a color to each category. Example: [‘blue’, ‘green’].
- colormapstr or
matplotlib.colors.Colormap, default None Colormap to select colors from. If string, load colormap with thatname from matplotlib.
- **kwds
Options to pass to matplotlib scatter plotting method.
- Returns:
See also
pandas.plotting.andrews_curvesPlot clustering visualization.
Examples
>>>df=pd.DataFrame(...{...'SepalLength':[6.5,7.7,5.1,5.8,7.6,5.0,5.4,4.6,6.7,4.6],...'SepalWidth':[3.0,3.8,3.8,2.7,3.0,2.3,3.0,3.2,3.3,3.6],...'PetalLength':[5.5,6.7,1.9,5.1,6.6,3.3,4.5,1.4,5.7,1.0],...'PetalWidth':[1.8,2.2,0.4,1.9,2.1,1.0,1.5,0.2,2.1,0.2],...'Category':[...'virginica',...'virginica',...'setosa',...'virginica',...'virginica',...'versicolor',...'versicolor',...'setosa',...'virginica',...'setosa'...]...}...)>>>pd.plotting.radviz(df,'Category')