Agent Visualization
Agent visualization allows you to generate a structured graphical representation of agents and their relationships usingGraphviz. This is useful for understanding how agents, tools, and handoffs interact within an application.
Installation
Install the optionalviz dependency group:
Generating a Graph
You can generate an agent visualization using thedraw_graph function. This function creates a directed graph where:
- Agents are represented as yellow boxes.
- MCP Servers are represented as grey boxes.
- Tools are represented as green ellipses.
- Handoffs are directed edges from one agent to another.
Example Usage
importosfromagentsimportAgent,function_toolfromagents.mcp.serverimportMCPServerStdiofromagents.extensions.visualizationimportdraw_graph@function_tooldefget_weather(city:str)->str:returnf"The weather in{city} is sunny."spanish_agent=Agent(name="Spanish agent",instructions="You only speak Spanish.",)english_agent=Agent(name="English agent",instructions="You only speak English",)current_dir=os.path.dirname(os.path.abspath(__file__))samples_dir=os.path.join(current_dir,"sample_files")mcp_server=MCPServerStdio(name="Filesystem Server, via npx",params={"command":"npx","args":["-y","@modelcontextprotocol/server-filesystem",samples_dir],},)triage_agent=Agent(name="Triage agent",instructions="Handoff to the appropriate agent based on the language of the request.",handoffs=[spanish_agent,english_agent],tools=[get_weather],mcp_servers=[mcp_server],)draw_graph(triage_agent)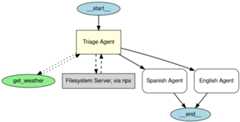
This generates a graph that visually represents the structure of thetriage agent and its connections to sub-agents and tools.
Understanding the Visualization
The generated graph includes:
- Astart node (
__start__) indicating the entry point. - Agents represented asrectangles with yellow fill.
- Tools represented asellipses with green fill.
- MCP Servers represented asrectangles with grey fill.
- Directed edges indicating interactions:
- Solid arrows for agent-to-agent handoffs.
- Dotted arrows for tool invocations.
- Dashed arrows for MCP server invocations.
- Anend node (
__end__) indicating where execution terminates.
Note: MCP servers are rendered in recent versions of theagents package (verified inv0.2.8). If you don’t see MCP boxesin your visualization, upgrade to the latest release.
Customizing the Graph
Showing the Graph
By default,draw_graph displays the graph inline. To show the graph in a separate window, write the following:
Saving the Graph
By default,draw_graph displays the graph inline. To save it as a file, specify a filename:
This will generateagent_graph.png in the working directory.