numpy.random.zipf#
- random.zipf(a,size=None)#
Draw samples from a Zipf distribution.
Samples are drawn from a Zipf distribution with specified parametera > 1.
The Zipf distribution (also known as the zeta distribution) is adiscrete probability distribution that satisfies Zipf’s law: thefrequency of an item is inversely proportional to its rank in afrequency table.
Note
New code should use the
zipfmethod of aGeneratorinstance instead;please see theQuick start.- Parameters:
- afloat or array_like of floats
Distribution parameter. Must be greater than 1.
- sizeint or tuple of ints, optional
Output shape. If the given shape is, e.g.,
(m,n,k), thenm*n*ksamples are drawn. If size isNone(default),a single value is returned ifais a scalar. Otherwise,np.array(a).sizesamples are drawn.
- Returns:
- outndarray or scalar
Drawn samples from the parameterized Zipf distribution.
See also
scipy.stats.zipfprobability density function, distribution, or cumulative density function, etc.
random.Generator.zipfwhich should be used for new code.
Notes
The probability mass function (PMF) for the Zipf distribution is
\[p(k) = \frac{k^{-a}}{\zeta(a)},\]for integers\(k \geq 1\), where\(\zeta\) is the Riemann Zetafunction.
It is named for the American linguist George Kingsley Zipf, who notedthat the frequency of any word in a sample of a language is inverselyproportional to its rank in the frequency table.
References
[1]Zipf, G. K., “Selected Studies of the Principle of RelativeFrequency in Language,” Cambridge, MA: Harvard Univ. Press,1932.
Examples
Draw samples from the distribution:
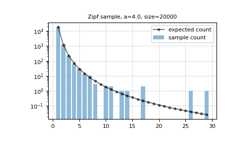
>>>a=4.0>>>n=20000>>>s=np.random.zipf(a,n)
Display the histogram of the samples, along withthe expected histogram based on the probabilitydensity function:
>>>importmatplotlib.pyplotasplt>>>fromscipy.specialimportzeta
bincountprovides a fast histogram for small integers.>>>count=np.bincount(s)>>>k=np.arange(1,s.max()+1)
>>>plt.bar(k,count[1:],alpha=0.5,label='sample count')>>>plt.plot(k,n*(k**-a)/zeta(a),'k.-',alpha=0.5,...label='expected count')>>>plt.semilogy()>>>plt.grid(alpha=0.4)>>>plt.legend()>>>plt.title(f'Zipf sample, a={a}, size={n}')>>>plt.show()