numpy.sin#
- numpy.sin(x,/,out=None,*,where=True,casting='same_kind',order='K',dtype=None,subok=True[,signature])=<ufunc'sin'>#
Trigonometric sine, element-wise.
- Parameters:
- xarray_like
Angle, in radians (\(2 \pi\) rad equals 360 degrees).
- outndarray, None, or tuple of ndarray and None, optional
A location into which the result is stored. If provided, it must havea shape that the inputs broadcast to. If not provided or None,a freshly-allocated array is returned. A tuple (possible only as akeyword argument) must have length equal to the number of outputs.
- wherearray_like, optional
This condition is broadcast over the input. At locations where thecondition is True, theout array will be set to the ufunc result.Elsewhere, theout array will retain its original value.Note that if an uninitializedout array is created via the default
out=None, locations within it where the condition is False willremain uninitialized.- **kwargs
For other keyword-only arguments, see theufunc docs.
- Returns:
- yarray_like
The sine of each element of x.This is a scalar ifx is a scalar.
Notes
The sine is one of the fundamental functions of trigonometry (themathematical study of triangles). Consider a circle of radius 1centered on the origin. A ray comes in from the\(+x\) axis, makesan angle at the origin (measured counter-clockwise from that axis), anddeparts from the origin. The\(y\) coordinate of the outgoingray’s intersection with the unit circle is the sine of that angle. Itranges from -1 for\(x=3\pi / 2\) to +1 for\(\pi / 2.\) Thefunction has zeroes where the angle is a multiple of\(\pi\).Sines of angles between\(\pi\) and\(2\pi\) are negative.The numerous properties of the sine and related functions are includedin any standard trigonometry text.
Examples
>>>importnumpyasnp
Print sine of one angle:
>>>np.sin(np.pi/2.)1.0
Print sines of an array of angles given in degrees:
>>>np.sin(np.array((0.,30.,45.,60.,90.))*np.pi/180.)array([ 0. , 0.5 , 0.70710678, 0.8660254 , 1. ])
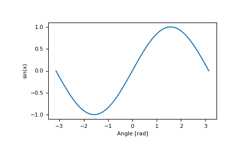
Plot the sine function:
>>>importmatplotlib.pylabasplt>>>x=np.linspace(-np.pi,np.pi,201)>>>plt.plot(x,np.sin(x))>>>plt.xlabel('Angle [rad]')>>>plt.ylabel('sin(x)')>>>plt.axis('tight')>>>plt.show()