

Note
Go to the endto download the full example code.
3D stem#
Demonstration of a stem plot in 3D, which plots vertical lines from a baselineto thez-coordinate and places a marker at the tip.
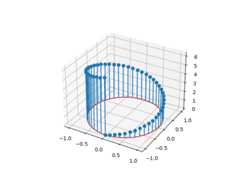
The position of the baseline can be adapted usingbottom. The parameterslinefmt,markerfmt, andbasefmt control basic format properties of theplot. However, in contrast toplot not all properties areconfigurable via keyword arguments. For more advanced control adapt the lineobjects returned bystem.
fig,ax=plt.subplots(subplot_kw=dict(projection='3d'))markerline,stemlines,baseline=ax.stem(x,y,z,linefmt='grey',markerfmt='D',bottom=np.pi)markerline.set_markerfacecolor('none')plt.show()
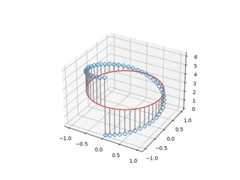
The orientation of the stems and baseline can be changed usingorientation.This determines in which direction the stems are projected from the headpoints, towards thebottom baseline.
For examples, by settingorientation='x', the stems are projected alongthex-direction, and the baseline is in theyz-plane.
Tags:plot-type: 3Dplot-type: specialtylevel: beginner
Total running time of the script: (0 minutes 1.676 seconds)