

Note
Go to the endto download the full example code.
errorbar(x, y, yerr, xerr)#
Plot y versus x as lines and/or markers with attached errorbars.
Seeerrorbar.
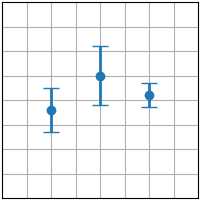
importmatplotlib.pyplotaspltimportnumpyasnpplt.style.use('_mpl-gallery')# make data:np.random.seed(1)x=[2,4,6]y=[3.6,5,4.2]yerr=[0.9,1.2,0.5]# plot:fig,ax=plt.subplots()ax.errorbar(x,y,yerr,fmt='o',linewidth=2,capsize=6)ax.set(xlim=(0,8),xticks=np.arange(1,8),ylim=(0,8),yticks=np.arange(1,8))plt.show()