

Note
Go to the endto download the full example code.
Specifying colors#
Color formats#
Matplotlib recognizes the following formats to specify a color.
Format | Example |
|---|---|
RGB or RGBA (red, green, blue, alpha)tuple of float values in a closedinterval [0, 1]. |
|
Case-insensitive hex RGB or RGBAstring. |
|
Case-insensitive RGB or RGBA stringequivalent hex shorthand ofduplicated characters. |
|
String representation of float valuein closed interval |
|
Single character shorthand notationfor some basic colors. Note The colors green, cyan, magenta,and yellow do not coincide withX11/CSS4 colors. Their particularshades were chosen for bettervisibility of colored linesagainst typical backgrounds. |
|
Case-insensitive X11/CSS4 color namewith no spaces. |
|
Case-insensitive color name fromxkcd color survey with |
|
Case-insensitive Tableau Colors from'T10' categorical palette. Note This is the default colorcycle. |
|
"CN" color spec where Note Matplotlib indexes colorat draw time and defaultsto black if cycle does notinclude color. |
|
| |
Tuple of one of the above colorformats and an alpha float. Added in version 3.8. |
|
The special value "none" is fullytransparent, i.e. equivalent to aRGBA value |
|
See also
- The following links provide more information on colors in Matplotlib.
Color Demo Example
List of named colors Example
"Red", "Green", and "Blue" are the intensities of those colors. In combination,they represent the colorspace.
Transparency#
Thealpha value of a color specifies its transparency, where 0 is fullytransparent and 1 is fully opaque. When a color is semi-transparent, thebackground color will show through.
Thealpha value determines the resulting color by blending theforeground color with the background color according to the formula
The following plot illustrates the effect of transparency.
importmatplotlib.pyplotaspltimportnumpyasnpfrommatplotlib.patchesimportRectanglefig,ax=plt.subplots(figsize=(6.5,1.65),layout='constrained')ax.add_patch(Rectangle((-0.2,-0.35),11.2,0.7,color='C1',alpha=0.8))fori,alphainenumerate(np.linspace(0,1,11)):ax.add_patch(Rectangle((i,0.05),0.8,0.6,alpha=alpha,zorder=0))ax.text(i+0.4,0.85,f"{alpha:.1f}",ha='center')ax.add_patch(Rectangle((i,-0.05),0.8,-0.6,alpha=alpha,zorder=2))ax.set_xlim(-0.2,13)ax.set_ylim(-1,1)ax.set_title('alpha values')ax.text(11.3,0.6,'zorder=1',va='center',color='C0')ax.text(11.3,0,'zorder=2\nalpha=0.8',va='center',color='C1')ax.text(11.3,-0.6,'zorder=3',va='center',color='C0')ax.axis('off')

The orange rectangle is semi-transparent withalpha = 0.8. The top row ofblue squares is drawn below and the bottom row of blue squares is drawn ontop of the orange rectangle.
See alsoZorder Demo to learn more on the drawing order.
"CN" color selection#
Matplotlib converts "CN" colors to RGBA when drawing Artists. TheStyling with cycler section contains additionalinformation about controlling colors and style properties.
importmatplotlib.pyplotaspltimportnumpyasnpimportmatplotlibasmplth=np.linspace(0,2*np.pi,128)defdemo(sty):mpl.style.use(sty)fig,ax=plt.subplots(figsize=(3,3))ax.set_title(f'style:{sty!r}',color='C0')ax.plot(th,np.cos(th),'C1',label='C1')ax.plot(th,np.sin(th),'C2',label='C2')ax.legend()demo('default')demo('seaborn-v0_8')


The first color'C0' is the title. Each plot uses the second and thirdcolors of each style'srcParams["axes.prop_cycle"] (default:cycler('color',[(0.12156862745098039,0.4666666666666667,0.7058823529411765),(1.0,0.4980392156862745,0.054901960784313725),(0.17254901960784313,0.6274509803921569,0.17254901960784313),(0.8392156862745098,0.15294117647058825,0.1568627450980392),(0.5803921568627451,0.403921568627451,0.7411764705882353),(0.5490196078431373,0.33725490196078434,0.29411764705882354),(0.8901960784313725,0.4666666666666667,0.7607843137254902),(0.4980392156862745,0.4980392156862745,0.4980392156862745),(0.7372549019607844,0.7411764705882353,0.13333333333333333),(0.09019607843137255,0.7450980392156863,0.8117647058823529)])). They are'C1' and'C2',respectively.
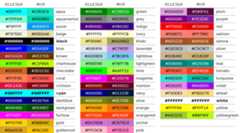
Comparison between X11/CSS4 and xkcd colors#
The xkcd colors come from auser survey conducted by the webcomic xkcd.
95 out of the 148 X11/CSS4 color names also appear in the xkcd color survey.Almost all of them map to different color values in the X11/CSS4 and inthe xkcd palette. Only 'black', 'white' and 'cyan' are identical.
For example,'blue' maps to'#0000FF' whereas'xkcd:blue' maps to'#0343DF'. Due to these name collisions, all xkcd colors have the'xkcd:' prefix.
The visual below shows name collisions. Color names where color values agreeare in bold.
importmatplotlib.colorsasmcolorsimportmatplotlib.patchesasmpatchoverlap={namefornameinmcolors.CSS4_COLORSiff'xkcd:{name}'inmcolors.XKCD_COLORS}fig=plt.figure(figsize=[9,5])ax=fig.add_axes((0,0,1,1))n_groups=3n_rows=len(overlap)//n_groups+1forj,color_nameinenumerate(sorted(overlap)):css4=mcolors.CSS4_COLORS[color_name]xkcd=mcolors.XKCD_COLORS[f'xkcd:{color_name}'].upper()# Pick text colour based on perceived luminance.rgba=mcolors.to_rgba_array([css4,xkcd])luma=0.299*rgba[:,0]+0.587*rgba[:,1]+0.114*rgba[:,2]css4_text_color='k'ifluma[0]>0.5else'w'xkcd_text_color='k'ifluma[1]>0.5else'w'col_shift=(j//n_rows)*3y_pos=j%n_rowstext_args=dict(fontsize=10,weight='bold'ifcss4==xkcdelseNone)ax.add_patch(mpatch.Rectangle((0+col_shift,y_pos),1,1,color=css4))ax.add_patch(mpatch.Rectangle((1+col_shift,y_pos),1,1,color=xkcd))ax.text(0.5+col_shift,y_pos+.7,css4,color=css4_text_color,ha='center',**text_args)ax.text(1.5+col_shift,y_pos+.7,xkcd,color=xkcd_text_color,ha='center',**text_args)ax.text(2+col_shift,y_pos+.7,f'{color_name}',**text_args)forginrange(n_groups):ax.hlines(range(n_rows),3*g,3*g+2.8,color='0.7',linewidth=1)ax.text(0.5+3*g,-0.3,'X11/CSS4',ha='center')ax.text(1.5+3*g,-0.3,'xkcd',ha='center')ax.set_xlim(0,3*n_groups)ax.set_ylim(n_rows,-1)ax.axis('off')plt.show()
Total running time of the script: (0 minutes 1.921 seconds)