

matplotlib.pyplot.grouped_bar#
- matplotlib.pyplot.grouped_bar(heights,*,positions=None,group_spacing=1.5,bar_spacing=0,tick_labels=None,labels=None,orientation='vertical',colors=None,**kwargs)[source]#
Make a grouped bar plot.
Added in version 3.11:The API is still provisional. We may still fine-tune some aspects based onuser-feedback.
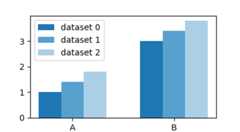
Grouped bar charts visualize a collection of categorical datasets. Each valuein a dataset belongs to a distinct category and these categories are the sameacross all datasets. The categories typically have string names, but couldalso be dates or index keys. The values in each dataset are represented by asequence of bars of the same color. The bars of all datasets are groupedtogether by their shared categories. The category names are drawn as the ticklabels for each bar group. Each dataset has a distinct bar color, and canoptionally get a label that is used for the legend.
Example:
grouped_bar([dataset_0,dataset_1,dataset_2],tick_labels=['A','B'],labels=['dataset 0','dataset 1','dataset 2'])
- Parameters:
- heightslist of array-like or dict of array-like or 2D array or pandas.DataFrame
The heights for all x and groups. One of:
list of array-like: A list of datasets, each dataset must havethe same number of elements.
# category_A, category_Bdataset_0 = [value_0_A, value_0_B]dataset_1 = [value_1_A, value_1_B]dataset_2 = [value_2_A, value_2_B]
Example call:
grouped_bar([dataset_0,dataset_1,dataset_2])
dict of array-like: A mapping from names to datasets. Each dataset(dict value) must have the same number of elements.
Example call:
data_dict={'ds0':dataset_0,'ds1':dataset_1,'ds2':dataset_2}grouped_bar(data_dict)
The names are used aslabels, i.e. this is equivalent to
grouped_bar(data_dict.values(),labels=data_dict.keys())
When using a dict input, you must not passlabels explicitly.
a 2D array: The rows are the categories, the columns are the differentdatasets.
dataset_0 dataset_1 dataset_2category_A ds0_a ds1_a ds2_acategory_B ds0_b ds1_b ds2_b
Example call:
categories=["A","B"]dataset_labels=["dataset_0","dataset_1","dataset_2"]array=np.random.random((2,3))grouped_bar(array,tick_labels=categories,labels=dataset_labels)
The index is used for the categories, the columns are used for thedatasets.
df=pd.DataFrame(np.random.random((2,3)),index=["A","B"],columns=["dataset_0","dataset_1","dataset_2"])grouped_bar(df)
i.e. this is equivalent to
grouped_bar(df.to_numpy(),tick_labels=df.index,labels=df.columns)
Note that
grouped_bar(df)produces a structurally equivalent plot likedf.plot.bar().
- positionsarray-like, optional
The center positions of the bar groups. The values have to be equidistant.If not given, a sequence of integer positions 0, 1, 2, ... is used.
- tick_labelslist of str, optional
The category labels, which are placed on ticks at the centerpositionsof the bar groups. If not set, the axis ticks (positions and labels) areleft unchanged.
- labelslist of str, optional
The labels of the datasets, i.e. the bars within one group.These will show up in the legend.
- group_spacingfloat, default: 1.5
The space between two bar groups as a multiple of bar width.
The default value of 1.5 thus means that there's a gap of1.5 bar widths between bar groups.
- bar_spacingfloat, default: 0
The space between bars as a multiple of bar width.
- orientation{"vertical", "horizontal"}, default: "vertical"
The direction of the bars.
- colorslist ofcolor, optional
A sequence of colors to be cycled through and used to color barsof the different datasets. The sequence need not be exactly thesame length as the number of provided y, in which case the colorswill repeat from the beginning.
If not specified, the colors from the Axes property cycle will be used.
- **kwargs
Rectangleproperties Properties applied to all bars. The following properties additionallyaccept a sequence of values corresponding to the datasets inheights:
edgecolor
facecolor
linewidth
linestyle
hatch
Property
Description
a filter function, which takes a (m, n, 3) float array and a dpi value, and returns a (m, n, 3) array and two offsets from the bottom left corner of the image
float or None
unknown
bool
bool or None
(left, bottom, width, height)
CapStyleor {'butt', 'projecting', 'round'}BboxBaseor Nonebool
Patch or (Path, Transform) or None
color or None
color or None
bool
str
{'/', '\', '|', '-', '+', 'x', 'o', 'O', '.', '*'}
unknown
color or 'edge' or None
unknown
bool
JoinStyleor {'miter', 'round', 'bevel'}object
{'-', '--', '-.', ':', '', (offset, on-off-seq), ...}
float or None
bool
list of
AbstractPathEffectNone or bool or float or callable
bool
(scale: float, length: float, randomness: float)
bool or None
str
bool
unknown
unknown
(float, float)
unknown
float
- Returns:
- _GroupedBarReturn
A provisional result object. This will be refined in the future.For now, the guaranteed API on the returned object is limited to
the attribute
bar_containers, which is a list ofBarContainer, i.e. the results of the individualbarcalls for each dataset.a
remove()method, that remove all bars from the Axes.See alsoArtist.remove().
See also
barA lower-level API for bar plots, with more degrees of freedom like individual bar sizes and colors.
Notes
Note
This is thepyplot wrapper for
axes.Axes.grouped_bar.For a better understanding, we compare the
grouped_barAPI withthose ofbarandboxplot.Comparison to bar()
grouped_barintentionally deviates from thebarAPI in someaspects.bar(x,y)is a lower-level API and places bars with heightyat explicit positionsx. It also allows to specify individual bar widthsand colors. This kind of detailed control and flexibility is difficult tomanage and often not needed when plotting multiple datasets as a grouped barplot. Therefore,grouped_barfocusses on the abstraction of bar plotsas visualization of categorical data.The following examples may help to transfer from
bartogrouped_bar.Positions are de-emphasized due to categories, and default to integer values.If you have used
range(N)as positions, you can leave that value out:bar(range(N),heights)grouped_bar([heights])
If needed, positions can be passed as keyword arguments:
bar(x,heights)grouped_bar([heights],positions=x)
To place category labels in
baryou could use the argumenttick_label or use a list of category names asx.grouped_barexpects them in the argumenttick_labels:bar(range(N),heights,tick_label=["A","B"])bar(["A","B"],heights)grouped_bar([heights],tick_labels=["A","B"])
Dataset labels, which are shown in the legend, are still passed via thelabel parameter:
bar(...,label="dataset")grouped_bar(...,label=["dataset"])
Comparison to boxplot()
Both,
grouped_barandboxplotvisualize categorical datafrom multiple datasets. The basic API ontick_labels andpositionsis the same, so that you can easily switch between plotting allindividual values asgrouped_baror the statistical distributionper category asboxplot:grouped_bar(values,positions=...,tick_labels=...)boxplot(values,positions=...,tick_labels=...)

