

matplotlib.sankey#
Module for creating Sankey diagrams using Matplotlib.
- classmatplotlib.sankey.Sankey(ax=None,scale=1.0,unit='',format='%G',gap=0.25,radius=0.1,shoulder=0.03,offset=0.15,head_angle=100,margin=0.4,tolerance=1e-06,**kwargs)[source]#
Bases:
objectSankey diagram.
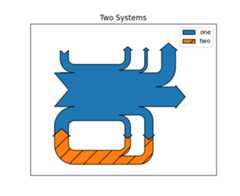
Sankey diagrams are a specific type of flow diagram, in whichthe width of the arrows is shown proportionally to the flowquantity. They are typically used to visualize energy ormaterial or cost transfers between processes.Wikipedia (6/1/2011)
Create a new Sankey instance.
The optional arguments listed below are applied to all subdiagrams sothat there is consistent alignment and formatting.
In order to draw a complex Sankey diagram, create an instance of
Sankeyby calling it without any kwargs:sankey=Sankey()
Then add simple Sankey sub-diagrams:
sankey.add()# 1sankey.add()# 2#...sankey.add()# n
Finally, create the full diagram:
sankey.finish()
Or, instead, simply daisy-chain those calls:
Sankey().add().add....add().finish()
- Other Parameters:
- ax
Axes Axes onto which the data should be plotted. Ifax isn'tprovided, new Axes will be created.
- scalefloat
Scaling factor for the flows.scale sizes the width of the pathsin order to maintain proper layout. The same scale is applied toall subdiagrams. The value should be chosen such that the productof the scale and the sum of the inputs is approximately 1.0 (andthe product of the scale and the sum of the outputs isapproximately -1.0).
- unitstr
The physical unit associated with the flow quantities. Ifunitis None, then none of the quantities are labeled.
- formatstr or callable
A Python number formatting string or callable used to label theflows with their quantities (i.e., a number times a unit, where theunit is given). If a format string is given, the label will be
format%quantity. If a callable is given, it will be calledwithquantityas an argument.- gapfloat
Space between paths that break in/break away to/from the top orbottom.
- radiusfloat
Inner radius of the vertical paths.
- shoulderfloat
Size of the shoulders of output arrows.
- offsetfloat
Text offset (from the dip or tip of the arrow).
- head_anglefloat
Angle, in degrees, of the arrow heads (and negative of the angle ofthe tails).
- marginfloat
Minimum space between Sankey outlines and the edge of the plotarea.
- tolerancefloat
Acceptable maximum of the magnitude of the sum of flows. Themagnitude of the sum of connected flows cannot be greater thantolerance.
- **kwargs
Any additional keyword arguments will be passed to
add, whichwill create the first subdiagram.
- ax
See also
Examples


- add(patchlabel='',flows=None,orientations=None,labels='',trunklength=1.0,pathlengths=0.25,prior=None,connect=(0,0),rotation=0,**kwargs)[source]#
Add a simple Sankey diagram with flows at the same hierarchical level.
- Parameters:
- patchlabelstr
Label to be placed at the center of the diagram.Note thatlabel (notpatchlabel) can be passed as keywordargument to create an entry in the legend.
- flowslist of float
Array of flow values. By convention, inputs are positive andoutputs are negative.
Flows are placed along the top of the diagram from the inside outin order of their index withinflows. They are placed along thesides of the diagram from the top down and along the bottom fromthe outside in.
If the sum of the inputs and outputs isnonzero, the discrepancy will appear as a cubic Bézier curve alongthe top and bottom edges of the trunk.
- orientationslist of {-1, 0, 1}
List of orientations of the flows (or a single orientation to beused for all flows). Valid values are 0 (inputs fromthe left, outputs to the right), 1 (from and to the top) or -1(from and to the bottom).
- labelslist of (str or None)
List of labels for the flows (or a single label to be used for allflows). Each label may beNone (no label), or a labeling string.If an entry is a (possibly empty) string, then the quantity for thecorresponding flow will be shown below the string. However, iftheunit of the main diagram is None, then quantities are nevershown, regardless of the value of this argument.
- trunklengthfloat
Length between the bases of the input and output groups (indata-space units).
- pathlengthslist of float
List of lengths of the vertical arrows before break-in or afterbreak-away. If a single value is given, then it will be applied tothe first (inside) paths on the top and bottom, and the length ofall other arrows will be justified accordingly. Thepathlengthsare not applied to the horizontal inputs and outputs.
- priorint
Index of the prior diagram to which this diagram should beconnected.
- connect(int, int)
A (prior, this) tuple indexing the flow of the prior diagram andthe flow of this diagram which should be connected. If this is thefirst diagram orprior isNone,connect will be ignored.
- rotationfloat
Angle of rotation of the diagram in degrees. The interpretation oftheorientations argument will be rotated accordingly (e.g., ifrotation == 90, anorientations entry of 1 means to/from theleft).rotation is ignored if this diagram is connected to anexisting one (usingprior andconnect).
- Returns:
- Sankey
The current
Sankeyinstance.
- Other Parameters:
- **kwargs
Additional keyword arguments set
matplotlib.patches.PathPatchproperties, listed below. For example, one may want to usefill=Falseorlabel="Alegendentry".Property
Description
a filter function, which takes a (m, n, 3) float array and a dpi value, and returns a (m, n, 3) array and two offsets from the bottom left corner of the image
unknown
bool
bool or None
CapStyleor {'butt', 'projecting', 'round'}BboxBaseor Nonebool
Patch or (Path, Transform) or None
color or None
color or None
color or None
bool
str
{'/', '\', '|', '-', '+', 'x', 'o', 'O', '.', '*'}
unknown
color or 'edge' or None
bool
JoinStyleor {'miter', 'round', 'bevel'}object
{'-', '--', '-.', ':', '', ...} or (offset, on-off-seq)
float or None
bool
list of
AbstractPathEffectNone or bool or float or callable
bool
(scale: float, length: float, randomness: float)
bool or None
str
bool
float
See also
- finish()[source]#
Adjust the Axes and return a list of information about the Sankeysubdiagram(s).
Returns a list of subdiagrams with the following fields:
Field
Description
patch
Sankey outline (a
PathPatch).flows
Flow values (positive for input, negative for output).
angles
List of angles of the arrows [deg/90].For example, if the diagram has not been rotated,an input to the top side has an angle of 3 (DOWN),and an output from the top side has an angle of 1 (UP).If a flow has been skipped (because its magnitude is lessthantolerance), then its angle will beNone.
tips
(N, 2)-array of the (x, y) positions of the tips (or "dips")of the flow paths.If the magnitude of a flow is less thetolerance of this
Sankeyinstance, the flow is skipped and its tip will be atthe center of the diagram.text
Textinstance for the diagram label.texts
List of
Textinstances for the flow labels.See also


