

Note
Go to the endto download the full example code.
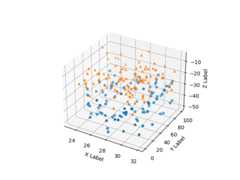
3D scatterplot#
Demonstration of a basic scatterplot in 3D.
importmatplotlib.pyplotaspltimportnumpyasnp# Fixing random state for reproducibilitynp.random.seed(19680801)defrandrange(n,vmin,vmax):""" Helper function to make an array of random numbers having shape (n, ) with each number distributed Uniform(vmin, vmax). """return(vmax-vmin)*np.random.rand(n)+vminfig=plt.figure()ax=fig.add_subplot(projection='3d')n=100# For each set of style and range settings, plot n random points in the box# defined by x in [23, 32], y in [0, 100], z in [zlow, zhigh].form,zlow,zhighin[('o',-50,-25),('^',-30,-5)]:xs=randrange(n,23,32)ys=randrange(n,0,100)zs=randrange(n,zlow,zhigh)ax.scatter(xs,ys,zs,marker=m)ax.set_xlabel('X Label')ax.set_ylabel('Y Label')ax.set_zlabel('Z Label')plt.show()
Tags:plot-type: 3Dplot-type: scatterlevel: beginner