

Note
Go to the endto download the full example code.
Positioning and orientation ofimshow images#
imshow() allows you to render an image (either a 2D array whichwill be color-mapped (based onnorm andcmap) or a 3D RGB(A) array whichwill be used as-is) to a rectangular region in data space. The orientation ofthe image in the final rendering is controlled by theorigin andextentkeyword arguments (and attributes on the resultingAxesImage instance) andthe data limits of the Axes.
Theextent keyword arguments controls the bounding box in data coordinatesthat the image will fill specified as(left,right,bottom,top) indatacoordinates, theorigin keyword argument controls how the image fills thatbounding box, and the orientation in the final rendered image is also affectedby the axes limits.
Hint
Most of the code below is used for adding labels and informativetext to the plots. The described effects oforigin andextent can beseen in the plots without the need to follow all code details.
For a quick understanding, you may want to skip the code details below anddirectly continue with the discussion of the results.
importmatplotlib.pyplotaspltimportnumpyasnpfrommatplotlib.gridspecimportGridSpecdefindex_to_coordinate(index,extent,origin):"""Return the pixel center of an index."""left,right,bottom,top=extenthshift=0.5*np.sign(right-left)left,right=left+hshift,right-hshiftvshift=0.5*np.sign(top-bottom)bottom,top=bottom+vshift,top-vshiftiforigin=='upper':bottom,top=top,bottomreturn{"[0, 0]":(left,bottom),"[M', 0]":(left,top),"[0, N']":(right,bottom),"[M', N']":(right,top),}[index]defget_index_label_pos(index,extent,origin,inverted_xindex):""" Return the desired position and horizontal alignment of an index label. """ifextentisNone:extent=lookup_extent(origin)left,right,bottom,top=extentx,y=index_to_coordinate(index,extent,origin)is_x0=index[-2:]=="0]"halign='left'ifis_x0^inverted_xindexelse'right'hshift=0.5*np.sign(left-right)x+=hshift*(1ifis_x0else-1)returnx,y,haligndefget_color(index,data,cmap):"""Return the data color of an index."""val={"[0, 0]":data[0,0],"[0, N']":data[0,-1],"[M', 0]":data[-1,0],"[M', N']":data[-1,-1],}[index]returncmap(val/data.max())deflookup_extent(origin):"""Return extent for label positioning when not given explicitly."""iforigin=='lower':return(-0.5,6.5,-0.5,5.5)else:return(-0.5,6.5,5.5,-0.5)defset_extent_None_text(ax):ax.text(3,2.5,'equals\nextent=None',size='large',ha='center',va='center',color='w')defplot_imshow_with_labels(ax,data,extent,origin,xlim,ylim):"""Actually run ``imshow()`` and add extent and index labels."""im=ax.imshow(data,origin=origin,extent=extent)# extent labels (left, right, bottom, top)left,right,bottom,top=im.get_extent()ifxlimisNoneortop>bottom:upper_string,lower_string='top','bottom'else:upper_string,lower_string='bottom','top'ifylimisNoneorleft<right:port_string,starboard_string='left','right'inverted_xindex=Falseelse:port_string,starboard_string='right','left'inverted_xindex=Truebbox_kwargs={'fc':'w','alpha':.75,'boxstyle':"round4"}ann_kwargs={'xycoords':'axes fraction','textcoords':'offset points','bbox':bbox_kwargs}ax.annotate(upper_string,xy=(.5,1),xytext=(0,-1),ha='center',va='top',**ann_kwargs)ax.annotate(lower_string,xy=(.5,0),xytext=(0,1),ha='center',va='bottom',**ann_kwargs)ax.annotate(port_string,xy=(0,.5),xytext=(1,0),ha='left',va='center',rotation=90,**ann_kwargs)ax.annotate(starboard_string,xy=(1,.5),xytext=(-1,0),ha='right',va='center',rotation=-90,**ann_kwargs)ax.set_title(f'origin:{origin}')# index labelsforindexin["[0, 0]","[0, N']","[M', 0]","[M', N']"]:tx,ty,halign=get_index_label_pos(index,extent,origin,inverted_xindex)facecolor=get_color(index,data,im.get_cmap())ax.text(tx,ty,index,color='white',ha=halign,va='center',bbox={'boxstyle':'square','facecolor':facecolor})ifxlim:ax.set_xlim(*xlim)ifylim:ax.set_ylim(*ylim)defgenerate_imshow_demo_grid(extents,xlim=None,ylim=None):N=len(extents)fig=plt.figure(tight_layout=True)fig.set_size_inches(6,N*(11.25)/5)gs=GridSpec(N,5,figure=fig)columns={'label':[fig.add_subplot(gs[j,0])forjinrange(N)],'upper':[fig.add_subplot(gs[j,1:3])forjinrange(N)],'lower':[fig.add_subplot(gs[j,3:5])forjinrange(N)]}x,y=np.ogrid[0:6,0:7]data=x+yfororiginin['upper','lower']:forax,extentinzip(columns[origin],extents):plot_imshow_with_labels(ax,data,extent,origin,xlim,ylim)columns['label'][0].set_title('extent=')forax,extentinzip(columns['label'],extents):ifextentisNone:text='None'else:left,right,bottom,top=extenttext=(f'left:{left:0.1f}\nright:{right:0.1f}\n'f'bottom:{bottom:0.1f}\ntop:{top:0.1f}\n')ax.text(1.,.5,text,transform=ax.transAxes,ha='right',va='center')ax.axis('off')returncolumns
Default extent#
First, let's have a look at the defaultextent=None
generate_imshow_demo_grid(extents=[None])
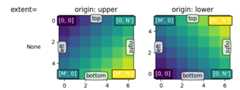
Generally, for an array of shape (M, N), the first index runs along thevertical, the second index runs along the horizontal.The pixel centers are at integer positions ranging from 0 toN'=N-1horizontally and from 0 toM'=M-1 vertically.origin determines how the data is filled in the bounding box.
Fororigin='lower':
[0, 0] is at (left, bottom)
[M', 0] is at (left, top)
[0, N'] is at (right, bottom)
[M', N'] is at (right, top)
origin='upper' reverses the vertical axes direction and filling:
[0, 0] is at (left, top)
[M', 0] is at (left, bottom)
[0, N'] is at (right, top)
[M', N'] is at (right, bottom)
In summary, the position of the [0, 0] index as well as the extent areinfluenced byorigin:
origin | [0, 0] position | extent |
|---|---|---|
upper | top left |
|
lower | bottom left |
|
The default value oforigin is set byrcParams["image.origin"] (default:'upper') which defaultsto'upper' to match the matrix indexing conventions in math andcomputer graphics image indexing conventions.
Explicit extent#
By settingextent we define the coordinates of the image area. Theunderlying image data is interpolated/resampled to fill that area.
If the Axes is set to autoscale, then the view limits of the Axes are setto match theextent which ensures that the coordinate set by(left,bottom) is at the bottom left of the Axes! However, thismay invert the axis so they do not increase in the 'natural' direction.
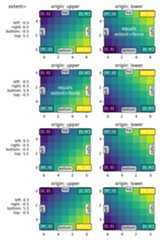
Explicit extent and axes limits#
If we fix the axes limits by explicitly settingset_xlim /set_ylim, we force a certain size and orientation of the Axes.This can decouple the 'left-right' and 'top-bottom' sense of the image fromthe orientation on the screen.
In the example below we have chosen the limits slightly larger than theextent (note the white areas within the Axes).
While we keep the extents as in the examples before, the coordinate (0, 0)is now explicitly put at the bottom left and values increase to up and tothe right (from the viewer's point of view).We can see that:
The coordinate
(left,bottom)anchors the image which then fills thebox going towards the(right,top)point in data space.The first column is always closest to the 'left'.
origin controls if the first row is closest to 'top' or 'bottom'.
The image may be inverted along either direction.
The 'left-right' and 'top-bottom' sense of the image may be uncoupled fromthe orientation on the screen.

Total running time of the script: (0 minutes 5.260 seconds)