

The mplot3d toolkit#
Generating 3D plots using the mplot3d toolkit.
This tutorial showcases various 3D plots. Click on the figures to see each fullgallery example with the code that generates the figures.
3D Axes (of classAxes3D) are created by passing theprojection="3d"keyword argument toFigure.add_subplot:
importmatplotlib.pyplotaspltfig=plt.figure()ax=fig.add_subplot(projection='3d')
Multiple 3D subplots can be added on the same figure, as for 2D subplots.

Changed in version 3.2.0:Prior to Matplotlib 3.2.0, it was necessary to explicitly import thempl_toolkits.mplot3d module to make the '3d' projection toFigure.add_subplot.
See themplot3d FAQ for more information about the mplot3dtoolkit.
Line plots#
SeeAxes3D.plot for API documentation.

Scatter plots#
SeeAxes3D.scatter for API documentation.

Wireframe plots#
SeeAxes3D.plot_wireframe for API documentation.

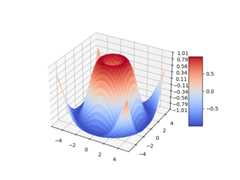
Surface plots#
SeeAxes3D.plot_surface for API documentation.
Tri-Surface plots#
SeeAxes3D.plot_trisurf for API documentation.

Contour plots#
SeeAxes3D.contour for API documentation.

Filled contour plots#
SeeAxes3D.contourf for API documentation.
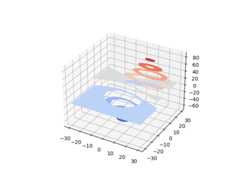
Added in version 1.1.0:The feature demoed in the second contourf3d example was enabled as aresult of a bugfix for version 1.1.0.
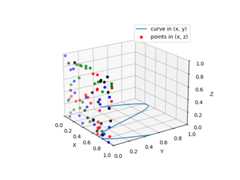
Fill between 3D lines#
SeeAxes3D.fill_between for API documentation.

Added in version 3.10.
Polygon plots#
SeeAxes3D.add_collection3d for API documentation.

Bar plots#
SeeAxes3D.bar for API documentation.

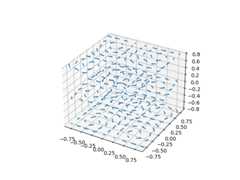
Quiver#
SeeAxes3D.quiver for API documentation.
2D plots in 3D#
Text#
SeeAxes3D.text for API documentation.
