

Note
Go to the endto download the full example code.
violinplot(D)#
Make a violin plot.
Seeviolinplot.
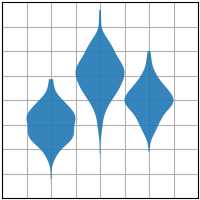
importmatplotlib.pyplotaspltimportnumpyasnpplt.style.use('_mpl-gallery')# make data:np.random.seed(10)D=np.random.normal((3,5,4),(0.75,1.00,0.75),(200,3))# plot:fig,ax=plt.subplots()vp=ax.violinplot(D,[2,4,6],widths=2,showmeans=False,showmedians=False,showextrema=False)# styling:forbodyinvp['bodies']:body.set_alpha(0.9)ax.set(xlim=(0,8),xticks=np.arange(1,8),ylim=(0,8),yticks=np.arange(1,8))plt.show()