

Note
Go to the endto download the full example code.
stem(x, y, z)#
Seestem.
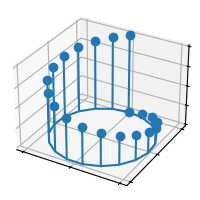
importmatplotlib.pyplotaspltimportnumpyasnpplt.style.use('_mpl-gallery')# Make datan=20x=np.sin(np.linspace(0,2*np.pi,n))y=np.cos(np.linspace(0,2*np.pi,n))z=np.linspace(0,1,n)# Plotfig,ax=plt.subplots(subplot_kw={"projection":"3d"})ax.stem(x,y,z)ax.set(xticklabels=[],yticklabels=[],zticklabels=[])plt.show()