

Note
Go to the endto download the full example code.
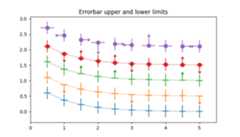
Including upper and lower limits in error bars#
In matplotlib, errors bars can have "limits". Applying limits to theerror bars essentially makes the error unidirectional. Because of that,upper and lower limits can be applied in both the y- and x-directionsvia theuplims,lolims,xuplims, andxlolims parameters,respectively. These parameters can be scalar or boolean arrays.
For example, ifxlolims isTrue, the x-error bars will onlyextend from the data towards increasing values. Ifuplims is anarray filled withFalse except for the 4th and 7th values, all of they-error bars will be bidirectional, except the 4th and 7th bars, whichwill extend from the data towards decreasing y-values.
importmatplotlib.pyplotaspltimportnumpyasnp# example datax=np.array([0.5,1.0,1.5,2.0,2.5,3.0,3.5,4.0,4.5,5.0])y=np.exp(-x)xerr=0.1yerr=0.2# lower & upper limits of the errorlolims=np.array([0,0,1,0,1,0,0,0,1,0],dtype=bool)uplims=np.array([0,1,0,0,0,1,0,0,0,1],dtype=bool)ls='dotted'fig,ax=plt.subplots(figsize=(7,4))# standard error barsax.errorbar(x,y,xerr=xerr,yerr=yerr,linestyle=ls)# including upper limitsax.errorbar(x,y+0.5,xerr=xerr,yerr=yerr,uplims=uplims,linestyle=ls)# including lower limitsax.errorbar(x,y+1.0,xerr=xerr,yerr=yerr,lolims=lolims,linestyle=ls)# including upper and lower limitsax.errorbar(x,y+1.5,xerr=xerr,yerr=yerr,lolims=lolims,uplims=uplims,marker='o',markersize=8,linestyle=ls)# Plot a series with lower and upper limits in both x & y# constant x-error with varying y-errorxerr=0.2yerr=np.full_like(x,0.2)yerr[[3,6]]=0.3# mock up some limits by modifying previous dataxlolims=lolimsxuplims=uplimslolims=np.zeros_like(x)uplims=np.zeros_like(x)lolims[[6]]=True# only limited at this indexuplims[[3]]=True# only limited at this index# do the plottingax.errorbar(x,y+2.1,xerr=xerr,yerr=yerr,xlolims=xlolims,xuplims=xuplims,uplims=uplims,lolims=lolims,marker='o',markersize=8,linestyle='none')# tidy up the figureax.set_xlim(0,5.5)ax.set_title('Errorbar upper and lower limits')plt.show()
Tags:plot-type: errorbardomain: statistics
References
The use of the following functions, methods, classes and modules is shownin this example: