

Note
Go to the endto download the full example code.
Demo Axes Grid#
Grid of 2x2 images with a single colorbar or with one colorbar per Axes.
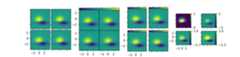
importmatplotlib.pyplotaspltfrommatplotlibimportcbookfrommpl_toolkits.axes_grid1importImageGridfig=plt.figure(figsize=(10.5,2.5))Z=cbook.get_sample_data("axes_grid/bivariate_normal.npy")# 15x15 arrayextent=(-3,4,-4,3)# A grid of 2x2 images with 0.05 inch pad between images and only the# lower-left Axes is labeled.grid=ImageGrid(fig,141,# similar to fig.add_subplot(141).nrows_ncols=(2,2),axes_pad=0.05,label_mode="1")foraxingrid:ax.imshow(Z,extent=extent)# This only affects Axes in first column and second row as share_all=False.grid.axes_llc.set(xticks=[-2,0,2],yticks=[-2,0,2])# A grid of 2x2 images with a single colorbar.grid=ImageGrid(fig,142,# similar to fig.add_subplot(142).nrows_ncols=(2,2),axes_pad=0.0,label_mode="L",share_all=True,cbar_location="top",cbar_mode="single")foraxingrid:im=ax.imshow(Z,extent=extent)grid.cbar_axes[0].colorbar(im)forcaxingrid.cbar_axes:cax.tick_params(labeltop=False)# This affects all Axes as share_all = True.grid.axes_llc.set(xticks=[-2,0,2],yticks=[-2,0,2])# A grid of 2x2 images. Each image has its own colorbar.grid=ImageGrid(fig,143,# similar to fig.add_subplot(143).nrows_ncols=(2,2),axes_pad=0.1,label_mode="1",share_all=True,cbar_location="top",cbar_mode="each",cbar_size="7%",cbar_pad="2%")forax,caxinzip(grid,grid.cbar_axes):im=ax.imshow(Z,extent=extent)cax.colorbar(im)cax.tick_params(labeltop=False)# This affects all Axes as share_all = True.grid.axes_llc.set(xticks=[-2,0,2],yticks=[-2,0,2])# A grid of 2x2 images. Each image has its own colorbar.grid=ImageGrid(fig,144,# similar to fig.add_subplot(144).nrows_ncols=(2,2),axes_pad=(0.45,0.15),label_mode="1",share_all=True,cbar_location="right",cbar_mode="each",cbar_size="7%",cbar_pad="2%")# Use a different colorbar range every timelimits=((0,1),(-2,2),(-1.7,1.4),(-1.5,1))forax,cax,vliminzip(grid,grid.cbar_axes,limits):im=ax.imshow(Z,extent=extent,vmin=vlim[0],vmax=vlim[1])cb=cax.colorbar(im)cb.set_ticks((vlim[0],vlim[1]))# This affects all Axes as share_all = True.grid.axes_llc.set(xticks=[-2,0,2],yticks=[-2,0,2])plt.show()
Total running time of the script: (0 minutes 1.074 seconds)