

Note
Go to the endto download the full example code.
Multiline#
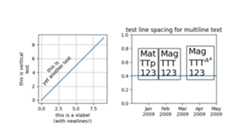
importmatplotlib.pyplotaspltimportnumpyasnpfig,(ax0,ax1)=plt.subplots(ncols=2,figsize=(7,4))ax0.set_aspect(1)ax0.plot(np.arange(10))ax0.set_xlabel('this is a xlabel\n(with newlines!)')ax0.set_ylabel('this is vertical\ntest',multialignment='center')ax0.text(2,7,'this is\nyet another test',rotation=45,horizontalalignment='center',verticalalignment='top',multialignment='center')ax0.grid()ax1.text(0.29,0.4,"Mat\nTTp\n123",size=18,va="baseline",ha="right",multialignment="left",bbox=dict(fc="none"))ax1.text(0.34,0.4,"Mag\nTTT\n123",size=18,va="baseline",ha="left",multialignment="left",bbox=dict(fc="none"))ax1.text(0.95,0.4,"Mag\nTTT$^{A^A}$\n123",size=18,va="baseline",ha="right",multialignment="left",bbox=dict(fc="none"))ax1.set_xticks([0.2,0.4,0.6,0.8,1.],labels=["Jan\n2009","Feb\n2009","Mar\n2009","Apr\n2009","May\n2009"])ax1.axhline(0.4)ax1.set_title("test line spacing for multiline text")fig.subplots_adjust(bottom=0.25,top=0.75)plt.show()