

Note
Go to the endto download the full example code.
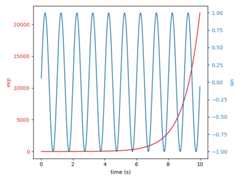
Plots with different scales#
Two plots on the same Axes with different left and right scales.
The trick is to usetwo different Axes that share the samex axis.You can use separatematplotlib.ticker formatters and locators asdesired since the two Axes are independent.
Such Axes are generated by calling theAxes.twinx method. Likewise,Axes.twiny is available to generate Axes that share ay axis buthave different top and bottom scales.
See alsoSecondary Axis for the casewhere the two scales are not independent, but related (e.g., the same quantityin two different units).
importmatplotlib.pyplotaspltimportnumpyasnp# Create some mock datat=np.arange(0.01,10.0,0.01)data1=np.exp(t)data2=np.sin(2*np.pi*t)fig,ax1=plt.subplots()color='tab:red'ax1.set_xlabel('time (s)')ax1.set_ylabel('exp',color=color)ax1.plot(t,data1,color=color)ax1.tick_params(axis='y',labelcolor=color)ax2=ax1.twinx()# instantiate a second Axes that shares the same x-axiscolor='tab:blue'ax2.set_ylabel('sin',color=color)# we already handled the x-label with ax1ax2.plot(t,data2,color=color)ax2.tick_params(axis='y',labelcolor=color)fig.tight_layout()# otherwise the right y-label is slightly clippedplt.show()
References
The use of the following functions, methods, classes and modules is shownin this example:
Tags:component: axesplot-type: linelevel: beginner