

Note
Go to the endto download the full example code.
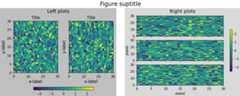
Figure subfigures#
Sometimes it is desirable to have a figure with two different layouts in it.This can be achieved withnested gridspecs,but having a virtual figure with its own artists is helpful, soMatplotlib also has "subfigures", accessed by callingmatplotlib.figure.Figure.add_subfigure in a way that is analogous tomatplotlib.figure.Figure.add_subplot, ormatplotlib.figure.Figure.subfigures to make an array of subfigures. Notethat subfigures can also have their own child subfigures.
importmatplotlib.pyplotaspltimportnumpyasnpdefexample_plot(ax,fontsize=12,hide_labels=False):pc=ax.pcolormesh(np.random.randn(30,30),vmin=-2.5,vmax=2.5)ifnothide_labels:ax.set_xlabel('x-label',fontsize=fontsize)ax.set_ylabel('y-label',fontsize=fontsize)ax.set_title('Title',fontsize=fontsize)returnpcnp.random.seed(19680808)# gridspec inside gridspecfig=plt.figure(layout='constrained',figsize=(10,4))subfigs=fig.subfigures(1,2,wspace=0.07)axsLeft=subfigs[0].subplots(1,2,sharey=True)subfigs[0].set_facecolor('0.75')foraxinaxsLeft:pc=example_plot(ax)subfigs[0].suptitle('Left plots',fontsize='x-large')subfigs[0].colorbar(pc,shrink=0.6,ax=axsLeft,location='bottom')axsRight=subfigs[1].subplots(3,1,sharex=True)fornn,axinenumerate(axsRight):pc=example_plot(ax,hide_labels=True)ifnn==2:ax.set_xlabel('xlabel')ifnn==1:ax.set_ylabel('ylabel')subfigs[1].set_facecolor('0.85')subfigs[1].colorbar(pc,shrink=0.6,ax=axsRight)subfigs[1].suptitle('Right plots',fontsize='x-large')fig.suptitle('Figure suptitle',fontsize='xx-large')plt.show()
It is possible to mix subplots and subfigures usingmatplotlib.figure.Figure.add_subfigure. This requires gettingthe gridspec that the subplots are laid out on.
fig,axs=plt.subplots(2,3,layout='constrained',figsize=(10,4))gridspec=axs[0,0].get_subplotspec().get_gridspec()# clear the left column for the subfigure:forainaxs[:,0]:a.remove()# plot data in remaining Axes:forainaxs[:,1:].flat:a.plot(np.arange(10))# make the subfigure in the empty gridspec slots:subfig=fig.add_subfigure(gridspec[:,0])axsLeft=subfig.subplots(1,2,sharey=True)subfig.set_facecolor('0.75')foraxinaxsLeft:pc=example_plot(ax)subfig.suptitle('Left plots',fontsize='x-large')subfig.colorbar(pc,shrink=0.6,ax=axsLeft,location='bottom')fig.suptitle('Figure suptitle',fontsize='xx-large')plt.show()

Subfigures can have different widths and heights. This is exactly thesame example as the first example, butwidth_ratios has been changed:
fig=plt.figure(layout='constrained',figsize=(10,4))subfigs=fig.subfigures(1,2,wspace=0.07,width_ratios=[2,1])axsLeft=subfigs[0].subplots(1,2,sharey=True)subfigs[0].set_facecolor('0.75')foraxinaxsLeft:pc=example_plot(ax)subfigs[0].suptitle('Left plots',fontsize='x-large')subfigs[0].colorbar(pc,shrink=0.6,ax=axsLeft,location='bottom')axsRight=subfigs[1].subplots(3,1,sharex=True)fornn,axinenumerate(axsRight):pc=example_plot(ax,hide_labels=True)ifnn==2:ax.set_xlabel('xlabel')ifnn==1:ax.set_ylabel('ylabel')subfigs[1].set_facecolor('0.85')subfigs[1].colorbar(pc,shrink=0.6,ax=axsRight)subfigs[1].suptitle('Right plots',fontsize='x-large')fig.suptitle('Figure suptitle',fontsize='xx-large')plt.show()

Subfigures can be also be nested:
fig=plt.figure(layout='constrained',figsize=(10,8))fig.suptitle('fig')subfigs=fig.subfigures(1,2,wspace=0.07)subfigs[0].set_facecolor('coral')subfigs[0].suptitle('subfigs[0]')subfigs[1].set_facecolor('coral')subfigs[1].suptitle('subfigs[1]')subfigsnest=subfigs[0].subfigures(2,1,height_ratios=[1,1.4])subfigsnest[0].suptitle('subfigsnest[0]')subfigsnest[0].set_facecolor('r')axsnest0=subfigsnest[0].subplots(1,2,sharey=True)fornn,axinenumerate(axsnest0):pc=example_plot(ax,hide_labels=True)subfigsnest[0].colorbar(pc,ax=axsnest0)subfigsnest[1].suptitle('subfigsnest[1]')subfigsnest[1].set_facecolor('g')axsnest1=subfigsnest[1].subplots(3,1,sharex=True)axsRight=subfigs[1].subplots(2,2)plt.show()

Tags:component: figureplot-type: pcolormeshlevel: intermediate
Total running time of the script: (0 minutes 6.542 seconds)