

Note
Go to the endto download the full example code.
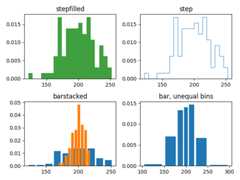
Demo of the histogram function's differenthisttype settings#
Histogram with step curve that has a color fill.
Histogram with step curve with no fill.
Histogram with custom and unequal bin widths.
Two histograms with stacked bars.
Selecting different bin counts and sizes can significantly affect theshape of a histogram. The Astropy docs have a great section on how toselect these parameters:http://docs.astropy.org/en/stable/visualization/histogram.html
importmatplotlib.pyplotaspltimportnumpyasnpnp.random.seed(19680801)mu_x=200sigma_x=25x=np.random.normal(mu_x,sigma_x,size=100)mu_w=200sigma_w=10w=np.random.normal(mu_w,sigma_w,size=100)fig,axs=plt.subplots(nrows=2,ncols=2)axs[0,0].hist(x,20,density=True,histtype='stepfilled',facecolor='g',alpha=0.75)axs[0,0].set_title('stepfilled')axs[0,1].hist(x,20,density=True,histtype='step',facecolor='g',alpha=0.75)axs[0,1].set_title('step')axs[1,0].hist(x,density=True,histtype='barstacked',rwidth=0.8)axs[1,0].hist(w,density=True,histtype='barstacked',rwidth=0.8)axs[1,0].set_title('barstacked')# Create a histogram by providing the bin edges (unequally spaced).bins=[100,150,180,195,205,220,250,300]axs[1,1].hist(x,bins,density=True,histtype='bar',rwidth=0.8)axs[1,1].set_title('bar, unequal bins')fig.tight_layout()plt.show()
Tags:plot-type: histogramdomain: statisticspurpose: reference
References
The use of the following functions, methods, classes and modules is shownin this example: