

Note
Go to the endto download the full example code.
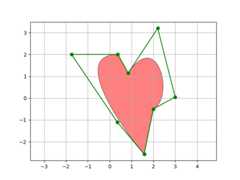
PathPatch object#
This example shows how to createPath andPathPatchobjects through Matplotlib's API.
importmatplotlib.pyplotaspltimportmatplotlib.patchesasmpatchesimportmatplotlib.pathasmpathfig,ax=plt.subplots()Path=mpath.Pathpath_data=[(Path.MOVETO,(1.58,-2.57)),(Path.CURVE4,(0.35,-1.1)),(Path.CURVE4,(-1.75,2.0)),(Path.CURVE4,(0.375,2.0)),(Path.LINETO,(0.85,1.15)),(Path.CURVE4,(2.2,3.2)),(Path.CURVE4,(3,0.05)),(Path.CURVE4,(2.0,-0.5)),(Path.CLOSEPOLY,(1.58,-2.57)),]codes,verts=zip(*path_data)path=mpath.Path(verts,codes)patch=mpatches.PathPatch(path,facecolor='r',alpha=0.5)ax.add_patch(patch)# plot control points and connecting linesx,y=zip(*path.vertices)line,=ax.plot(x,y,'go-')ax.grid()ax.axis('equal')plt.show()
References
The use of the following functions, methods, classes and modules is shownin this example: