

Note
Go to the endto download the full example code.
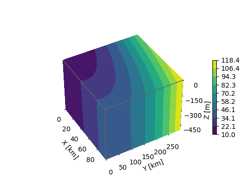
3D box surface plot#
Given data on a gridded volumeX,Y,Z, this example plots thedata values on the volume surfaces.
The strategy is to select the data from each surface and plotcontours separately usingaxes3d.Axes3D.contourf with appropriateparameterszdir andoffset.
importmatplotlib.pyplotaspltimportnumpyasnp# Define dimensionsNx,Ny,Nz=100,300,500X,Y,Z=np.meshgrid(np.arange(Nx),np.arange(Ny),-np.arange(Nz))# Create fake datadata=(((X+100)**2+(Y-20)**2+2*Z)/1000+1)kw={'vmin':data.min(),'vmax':data.max(),'levels':np.linspace(data.min(),data.max(),10),}# Create a figure with 3D axfig=plt.figure(figsize=(5,4))ax=fig.add_subplot(111,projection='3d')# Plot contour surfaces_=ax.contourf(X[:,:,0],Y[:,:,0],data[:,:,0],zdir='z',offset=0,**kw)_=ax.contourf(X[0,:,:],data[0,:,:],Z[0,:,:],zdir='y',offset=0,**kw)C=ax.contourf(data[:,-1,:],Y[:,-1,:],Z[:,-1,:],zdir='x',offset=X.max(),**kw)# --# Set limits of the plot from coord limitsxmin,xmax=X.min(),X.max()ymin,ymax=Y.min(),Y.max()zmin,zmax=Z.min(),Z.max()ax.set(xlim=(xmin,xmax),ylim=(ymin,ymax),zlim=(zmin,zmax))# Plot edgesedges_kw=dict(color='0.4',linewidth=1,zorder=1e3)ax.plot([xmax,xmax],[ymin,ymax],0,**edges_kw)ax.plot([xmin,xmax],[ymin,ymin],0,**edges_kw)ax.plot([xmax,xmax],[ymin,ymin],[zmin,zmax],**edges_kw)# Set labels and zticksax.set(xlabel='X [km]',ylabel='Y [km]',zlabel='Z [m]',zticks=[0,-150,-300,-450],)# Set zoom and angle viewax.view_init(40,-30,0)ax.set_box_aspect(None,zoom=0.9)# Colorbarfig.colorbar(C,ax=ax,fraction=0.02,pad=0.1,label='Name [units]')# Show Figureplt.show()
Tags:plot-type: 3Dlevel: intermediate
Total running time of the script: (0 minutes 2.340 seconds)