

Note
Go to the endto download the full example code.
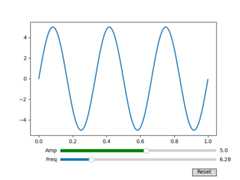
Snap sliders to discrete values#
You can snap slider values to discrete values using thevalstep argument.
In this example the Freq slider is constrained to be multiples of pi, and theAmp slider uses an array as thevalstep argument to more densely samplethe first part of its range.
SeeSlider for an example of usingaSlider to control a single float.
SeeImage scaling using a RangeSlider for an example of usingaRangeSlider to define a range of values.
importmatplotlib.pyplotaspltimportnumpyasnpfrommatplotlib.widgetsimportButton,Slidert=np.arange(0.0,1.0,0.001)a0=5f0=3s=a0*np.sin(2*np.pi*f0*t)fig,ax=plt.subplots()fig.subplots_adjust(bottom=0.25)l,=ax.plot(t,s,lw=2)ax_freq=fig.add_axes((0.25,0.1,0.65,0.03))ax_amp=fig.add_axes((0.25,0.15,0.65,0.03))# define the values to use for snappingallowed_amplitudes=np.concatenate([np.linspace(.1,5,100),[6,7,8,9]])# create the sliderssamp=Slider(ax_amp,"Amp",0.1,9.0,valinit=a0,valstep=allowed_amplitudes,color="green")sfreq=Slider(ax_freq,"Freq",0,10*np.pi,valinit=2*np.pi,valstep=np.pi,initcolor='none'# Remove the line marking the valinit position.)defupdate(val):amp=samp.valfreq=sfreq.vall.set_ydata(amp*np.sin(2*np.pi*freq*t))fig.canvas.draw_idle()sfreq.on_changed(update)samp.on_changed(update)ax_reset=fig.add_axes((0.8,0.025,0.1,0.04))button=Button(ax_reset,'Reset',hovercolor='0.975')defreset(event):sfreq.reset()samp.reset()button.on_clicked(reset)plt.show()
References
The use of the following functions, methods, classes and modules is shownin this example: