

Note
Go to the endto download the full example code.
Bar demo with units#
A plot using a variety of centimetre and inch conversions. This example showshow default unit introspection works (ax1), how various keywords can be used toset the x and y units to override the defaults (ax2, ax3, ax4) and how one canset the xlimits using scalars (ax3, current units assumed) or units(conversions applied to get the numbers to current units).
This example requiresbasic_units.py
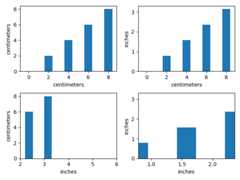
frombasic_unitsimportcm,inchimportmatplotlib.pyplotaspltimportnumpyasnpcms=cm*np.arange(0,10,2)bottom=0*cmwidth=0.8*cmfig,axs=plt.subplots(2,2)axs[0,0].bar(cms,cms,bottom=bottom)axs[0,1].bar(cms,cms,bottom=bottom,width=width,xunits=cm,yunits=inch)axs[1,0].bar(cms,cms,bottom=bottom,width=width,xunits=inch,yunits=cm)axs[1,0].set_xlim(2,6)# scalars are interpreted in current unitsaxs[1,1].bar(cms,cms,bottom=bottom,width=width,xunits=inch,yunits=inch)axs[1,1].set_xlim(2*cm,6*cm)# cm are converted to inchesfig.tight_layout()plt.show()