

Note
Go to the endto download the full example code.
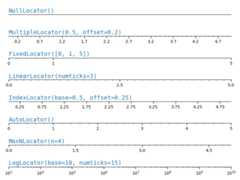
Tick locators#
Tick locators define the position of the ticks.
This example illustrates the usage and effect of the most common locators.
importmatplotlib.pyplotaspltimportnumpyasnpimportmatplotlib.tickerastickerdefsetup(ax,title):"""Set up common parameters for the Axes in the example."""# only show the bottom spineax.yaxis.set_major_locator(ticker.NullLocator())ax.spines[['left','right','top']].set_visible(False)ax.xaxis.set_ticks_position('bottom')ax.tick_params(which='major',width=1.00,length=5)ax.tick_params(which='minor',width=0.75,length=2.5)ax.set_xlim(0,5)ax.set_ylim(0,1)ax.text(0.0,0.2,title,transform=ax.transAxes,fontsize=14,fontname='Monospace',color='tab:blue')fig,axs=plt.subplots(8,1,figsize=(8,6))# Null Locatorsetup(axs[0],title="NullLocator()")axs[0].xaxis.set_major_locator(ticker.NullLocator())axs[0].xaxis.set_minor_locator(ticker.NullLocator())# Multiple Locatorsetup(axs[1],title="MultipleLocator(0.5, offset=0.2)")axs[1].xaxis.set_major_locator(ticker.MultipleLocator(0.5,offset=0.2))axs[1].xaxis.set_minor_locator(ticker.MultipleLocator(0.1))# Fixed Locatorsetup(axs[2],title="FixedLocator([0, 1, 5])")axs[2].xaxis.set_major_locator(ticker.FixedLocator([0,1,5]))axs[2].xaxis.set_minor_locator(ticker.FixedLocator(np.linspace(0.2,0.8,4)))# Linear Locatorsetup(axs[3],title="LinearLocator(numticks=3)")axs[3].xaxis.set_major_locator(ticker.LinearLocator(3))axs[3].xaxis.set_minor_locator(ticker.LinearLocator(31))# Index Locatorsetup(axs[4],title="IndexLocator(base=0.5, offset=0.25)")axs[4].plot([0]*5,color='white')axs[4].xaxis.set_major_locator(ticker.IndexLocator(base=0.5,offset=0.25))# Auto Locatorsetup(axs[5],title="AutoLocator()")axs[5].xaxis.set_major_locator(ticker.AutoLocator())axs[5].xaxis.set_minor_locator(ticker.AutoMinorLocator())# MaxN Locatorsetup(axs[6],title="MaxNLocator(n=4)")axs[6].xaxis.set_major_locator(ticker.MaxNLocator(4))axs[6].xaxis.set_minor_locator(ticker.MaxNLocator(40))# Log Locatorsetup(axs[7],title="LogLocator(base=10, numticks=15)")axs[7].set_xlim(10**3,10**10)axs[7].set_xscale('log')axs[7].xaxis.set_major_locator(ticker.LogLocator(base=10,numticks=15))plt.tight_layout()plt.show()
References
The following functions, methods, classes and modules are used in this example:
Total running time of the script: (0 minutes 1.403 seconds)