

Note
Go to the endto download the full example code.
Custom Ticker#
Thematplotlib.ticker module defines many preset tickers, but wasprimarily designed for extensibility, i.e., to support user customized ticking.
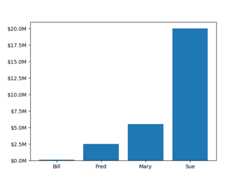
In this example, a user defined function is used to format the ticks inmillions of dollars on the y-axis.
importmatplotlib.pyplotaspltdefmillions(x,pos):"""The two arguments are the value and tick position."""returnf'${x*1e-6:1.1f}M'fig,ax=plt.subplots()# set_major_formatter internally creates a FuncFormatter from the callable.ax.yaxis.set_major_formatter(millions)money=[1.5e5,2.5e6,5.5e6,2.0e7]ax.bar(['Bill','Fred','Mary','Sue'],money)plt.show()
References
The use of the following functions, methods, classes and modules is shownin this example: