

Note
Go to the endto download the full example code.
Plotting with keywords#
Some data structures, like dict,structured numpy arrayorpandas.DataFrame provide access to labelled data via string index accessdata[key].
For these data types, Matplotlib supports passing the whole datastructure via thedata keyword argument, and using the string names as plot function parameters,where you'd normally pass in your data.
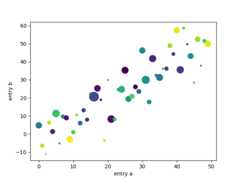
importmatplotlib.pyplotaspltimportnumpyasnpnp.random.seed(19680801)data={'a':np.arange(50),'c':np.random.randint(0,50,50),'d':np.random.randn(50)}data['b']=data['a']+10*np.random.randn(50)data['d']=np.abs(data['d'])*100fig,ax=plt.subplots()ax.scatter('a','b',c='c',s='d',data=data)ax.set(xlabel='entry a',ylabel='entry b')plt.show()