

Note
Go to the endto download the full example code.
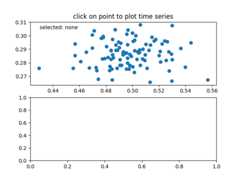
Data browser#
Connecting data between multiple canvases.
This example covers how to interact data with multiple canvases. Thislets you select and highlight a point on one axis, and generating thedata of that point on the other axis.
Note
This example exercises the interactive capabilities of Matplotlib, and thiswill not appear in the static documentation. Please run this code on yourmachine to see the interactivity.
You can copy and paste individual parts, or download the entire exampleusing the link at the bottom of the page.
importnumpyasnpclassPointBrowser:""" Click on a point to select and highlight it -- the data that generated the point will be shown in the lower Axes. Use the 'n' and 'p' keys to browse through the next and previous points """def__init__(self):self.lastind=0self.text=ax.text(0.05,0.95,'selected: none',transform=ax.transAxes,va='top')self.selected,=ax.plot([xs[0]],[ys[0]],'o',ms=12,alpha=0.4,color='yellow',visible=False)defon_press(self,event):ifself.lastindisNone:returnifevent.keynotin('n','p'):returnifevent.key=='n':inc=1else:inc=-1self.lastind+=incself.lastind=np.clip(self.lastind,0,len(xs)-1)self.update()defon_pick(self,event):ifevent.artist!=line:returnTrueN=len(event.ind)ifnotN:returnTrue# the click locationsx=event.mouseevent.xdatay=event.mouseevent.ydatadistances=np.hypot(x-xs[event.ind],y-ys[event.ind])indmin=distances.argmin()dataind=event.ind[indmin]self.lastind=dataindself.update()defupdate(self):ifself.lastindisNone:returndataind=self.lastindax2.clear()ax2.plot(X[dataind])ax2.text(0.05,0.9,f'mu={xs[dataind]:1.3f}\nsigma={ys[dataind]:1.3f}',transform=ax2.transAxes,va='top')ax2.set_ylim(-0.5,1.5)self.selected.set_visible(True)self.selected.set_data([xs[dataind]],[ys[dataind]])self.text.set_text('selected:%d'%dataind)fig.canvas.draw()if__name__=='__main__':importmatplotlib.pyplotasplt# Fixing random state for reproducibilitynp.random.seed(19680801)X=np.random.rand(100,200)xs=np.mean(X,axis=1)ys=np.std(X,axis=1)fig,(ax,ax2)=plt.subplots(2,1)ax.set_title('click on point to plot time series')line,=ax.plot(xs,ys,'o',picker=True,pickradius=5)browser=PointBrowser()fig.canvas.mpl_connect('pick_event',browser.on_pick)fig.canvas.mpl_connect('key_press_event',browser.on_press)plt.show()