Note
Go to the endto download the full example code.
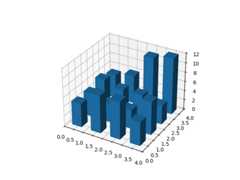
Create 3D histogram of 2D data#
Demo of a histogram for 2D data as a bar graph in 3D.
importmatplotlib.pyplotaspltimportnumpyasnp# Fixing random state for reproducibilitynp.random.seed(19680801)fig=plt.figure()ax=fig.add_subplot(projection='3d')x,y=np.random.rand(2,100)*4hist,xedges,yedges=np.histogram2d(x,y,bins=4,range=[[0,4],[0,4]])# Construct arrays for the anchor positions of the 16 bars.xpos,ypos=np.meshgrid(xedges[:-1]+0.25,yedges[:-1]+0.25,indexing="ij")xpos=xpos.ravel()ypos=ypos.ravel()zpos=0# Construct arrays with the dimensions for the 16 bars.dx=dy=0.5*np.ones_like(zpos)dz=hist.ravel()ax.bar3d(xpos,ypos,zpos,dx,dy,dz,zsort='average')plt.show()