

Note
Go to the endto download the full example code.
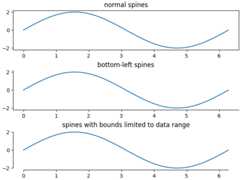
Spines#
This demo compares:
normal Axes, with spines on all four sides;
an Axes with spines only on the left and bottom;
an Axes using custom bounds to limit the extent of the spine.
Eachaxes.Axes has a list ofSpine objects, accessiblevia the containerax.spines.
importmatplotlib.pyplotaspltimportnumpyasnpx=np.linspace(0,2*np.pi,100)y=2*np.sin(x)# Constrained layout makes sure the labels don't overlap the Axes.fig,(ax0,ax1,ax2)=plt.subplots(nrows=3,layout='constrained')ax0.plot(x,y)ax0.set_title('normal spines')ax1.plot(x,y)ax1.set_title('bottom-left spines')# Hide the right and top spinesax1.spines.right.set_visible(False)ax1.spines.top.set_visible(False)ax2.plot(x,y)ax2.set_title('spines with bounds limited to data range')# Only draw spines for the data range, not in the marginsax2.spines.bottom.set_bounds(x.min(),x.max())ax2.spines.left.set_bounds(y.min(),y.max())# Hide the right and top spinesax2.spines.right.set_visible(False)ax2.spines.top.set_visible(False)plt.show()
References
The use of the following functions, methods, classes and modules is shownin this example: