

Note
Go to the endto download the full example code.
Simple plot#
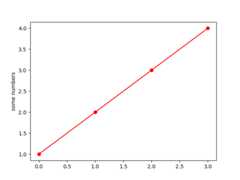
A simple plot where a list of numbers are plotted against their index,resulting in a straight line. Use a format string (here, 'o-r') to set themarkers (circles), linestyle (solid line) and color (red).
importmatplotlib.pyplotaspltplt.plot([1,2,3,4],'o-r')plt.ylabel('some numbers')plt.show()
References
The use of the following functions, methods, classes and modules is shownin this example: