

Note
Go to the endto download the full example code.
Slider#
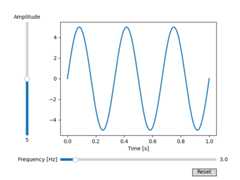
In this example, sliders are used to control the frequency and amplitude ofa sine wave.
SeeSnap sliders to discrete values for an example of havingtheSlider snap to discrete values.
SeeImage scaling using a RangeSlider for an example of usingaRangeSlider to define a range of values.
importmatplotlib.pyplotaspltimportnumpyasnpfrommatplotlib.widgetsimportButton,Slider# The parametrized function to be plotteddeff(t,amplitude,frequency):returnamplitude*np.sin(2*np.pi*frequency*t)t=np.linspace(0,1,1000)# Define initial parametersinit_amplitude=5init_frequency=3# Create the figure and the line that we will manipulatefig,ax=plt.subplots()line,=ax.plot(t,f(t,init_amplitude,init_frequency),lw=2)ax.set_xlabel('Time [s]')# adjust the main plot to make room for the slidersfig.subplots_adjust(left=0.25,bottom=0.25)# Make a horizontal slider to control the frequency.axfreq=fig.add_axes((0.25,0.1,0.65,0.03))freq_slider=Slider(ax=axfreq,label='Frequency [Hz]',valmin=0.1,valmax=30,valinit=init_frequency,)# Make a vertically oriented slider to control the amplitudeaxamp=fig.add_axes((0.1,0.25,0.0225,0.63))amp_slider=Slider(ax=axamp,label="Amplitude",valmin=0,valmax=10,valinit=init_amplitude,orientation="vertical")# The function to be called anytime a slider's value changesdefupdate(val):line.set_ydata(f(t,amp_slider.val,freq_slider.val))fig.canvas.draw_idle()# register the update function with each sliderfreq_slider.on_changed(update)amp_slider.on_changed(update)# Create a `matplotlib.widgets.Button` to reset the sliders to initial values.resetax=fig.add_axes((0.8,0.025,0.1,0.04))button=Button(resetax,'Reset',hovercolor='0.975')defreset(event):freq_slider.reset()amp_slider.reset()button.on_clicked(reset)plt.show()
References
The use of the following functions, methods, classes and modules is shownin this example: