

Note
Go to the endto download the full example code.
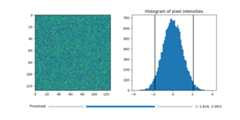
Image scaling using a RangeSlider#
Using the RangeSlider widget to control the thresholding of an image.
The RangeSlider widget can be used similarly to thewidgets.Sliderwidget. The major difference is that RangeSlider'sval attributeis a tuple of floats(lowerval,upperval) rather than a single float.
SeeSlider for an example of usingaSlider to control a single float.
SeeSnap sliders to discrete values for an example of havingtheSlider snap to discrete values.
importmatplotlib.pyplotaspltimportnumpyasnpfrommatplotlib.widgetsimportRangeSlider# generate a fake imagenp.random.seed(19680801)N=128img=np.random.randn(N,N)fig,axs=plt.subplots(1,2,figsize=(10,5))fig.subplots_adjust(bottom=0.25)im=axs[0].imshow(img)axs[1].hist(img.flatten(),bins='auto')axs[1].set_title('Histogram of pixel intensities')# Create the RangeSliderslider_ax=fig.add_axes((0.20,0.1,0.60,0.03))slider=RangeSlider(slider_ax,"Threshold",img.min(),img.max())# Create the Vertical lines on the histogramlower_limit_line=axs[1].axvline(slider.val[0],color='k')upper_limit_line=axs[1].axvline(slider.val[1],color='k')defupdate(val):# The val passed to a callback by the RangeSlider will# be a tuple of (min, max)# Update the image's colormapim.norm.vmin=val[0]im.norm.vmax=val[1]# Update the position of the vertical lineslower_limit_line.set_xdata([val[0],val[0]])upper_limit_line.set_xdata([val[1],val[1]])# Redraw the figure to ensure it updatesfig.canvas.draw_idle()slider.on_changed(update)plt.show()
References
The use of the following functions, methods, classes and modules is shownin this example:
Total running time of the script: (0 minutes 1.036 seconds)