Note
Go to the endto download the full example code.
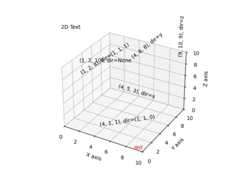
Text annotations in 3D#
Demonstrates the placement of text annotations on a 3D plot.
Functionality shown:
Using the
textfunction with three types ofzdir values: None,an axis name (ex. 'x'), or a direction tuple (ex. (1, 1, 0)).Using the
textfunction with the color keyword.Using the
text2Dfunction to place text on a fixed position on the axobject.
importmatplotlib.pyplotaspltax=plt.figure().add_subplot(projection='3d')# Demo 1: zdirzdirs=(None,'x','y','z',(1,1,0),(1,1,1))xs=(1,4,4,9,4,1)ys=(2,5,8,10,1,2)zs=(10,3,8,9,1,8)forzdir,x,y,zinzip(zdirs,xs,ys,zs):label='(%d,%d,%d), dir=%s'%(x,y,z,zdir)ax.text(x,y,z,label,zdir)# Demo 2: colorax.text(9,0,0,"red",color='red')# Demo 3: text2D# Placement 0, 0 would be the bottom left, 1, 1 would be the top right.ax.text2D(0.05,0.95,"2D Text",transform=ax.transAxes)# Tweaking display region and labelsax.set_xlim(0,10)ax.set_ylim(0,10)ax.set_zlim(0,10)ax.set_xlabel('X axis')ax.set_ylabel('Y axis')ax.set_zlabel('Z axis')plt.show()