

Note
Go to the endto download the full example code.
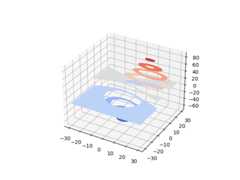
Filled contours#
Axes3D.contourf differs fromAxes3D.contour in that it creates filledcontours, i.e. a discrete number of colours are used to shade the domain.
This is like aAxes.contourf plot in 2D except that the shaded regioncorresponding to the level c is graphed on the planez=c.
importmatplotlib.pyplotaspltfrommpl_toolkits.mplot3dimportaxes3dax=plt.figure().add_subplot(projection='3d')X,Y,Z=axes3d.get_test_data(0.05)ax.contourf(X,Y,Z,cmap="coolwarm")plt.show()
Tags:plot-type: 3Dlevel: beginner