

The axes_grid1 toolkit#
axes_grid1 provides the following features:
Helper classes (ImageGrid,RGBAxes,AxesDivider) to ease the layout ofaxes displaying images with a fixed aspect ratio while satisfying additionalconstraints (matching the heights of a colorbar and an image, or fixing thepadding between images);
ParasiteAxes (twinx/twiny-like features so that you can plot different data(e.g., different y-scale) in a same Axes);
AnchoredArtists (custom artists which are placed at an anchored position,similarly to legends).

axes_grid1#
ImageGrid#
In Matplotlib, axes location and size are usually specified in normalizedfigure coordinates (0 = bottom left, 1 = top right), which makesit difficult to achieve a fixed (absolute) padding between images.ImageGrid can be used to achieve such a padding; seeits docs for detailed API information.

The position of each axes is determined at the drawing time (seeAxesDivider), so that the size of the entire grid fits in thegiven rectangle (like the aspect of axes). Note that in this example,the paddings between axes are fixed even if you change the figuresize.
Axes in the same column share their x-axis, and axes in the same row sharetheir y-axis (in the sense of
sharex,sharey).Additionally, Axes in the same column all have the same width, and axes inthe same row all have the same height. These widths and heights are scaledin proportion to the axes' view limits (xlim or ylim).
The examples below show what you can do with ImageGrid.
AxesDivider class#
Behind the scenes, ImageGrid (and RGBAxes, described below) rely onAxesDivider, whose role is to calculate thelocation of the axes at drawing time.
Users typically do not need to directly instantiate dividersby callingAxesDivider; instead,make_axes_locatable can be used to create a dividerfor an Axes:
ax=subplot(1,1,1)divider=make_axes_locatable(ax)
AxesDivider.append_axes can then be used to create a new axes on a givenside ("left", "right", "top", "bottom") of the original axes.
colorbar whose height (or width) is in sync with the main axes#

scatter_hist.py with AxesDivider#
TheScatter plot with histograms example can berewritten usingmake_axes_locatable:
axScatter=plt.subplot()axScatter.scatter(x,y)axScatter.set_aspect(1.)# create new axes on the right and on the top of the current axes.divider=make_axes_locatable(axScatter)axHistx=divider.append_axes("top",size=1.2,pad=0.1,sharex=axScatter)axHisty=divider.append_axes("right",size=1.2,pad=0.1,sharey=axScatter)# the scatter plot:# histogramsbins=np.arange(-lim,lim+binwidth,binwidth)axHistx.hist(x,bins=bins)axHisty.hist(y,bins=bins,orientation='horizontal')
See the full source code below.

TheAlign histogram to scatter plot using locatable Axes using theAxesDivider has some advantages over theoriginalScatter plot with histograms in Matplotlib.For example, you can set the aspect ratio of the scatter plot, even with thex-axis or y-axis is shared accordingly.
ParasiteAxes#
The ParasiteAxes is an Axes whose location is identical to its hostaxes. The location is adjusted in the drawing time, thus it works evenif the host change its location (e.g., images).
In most cases, you first create a host axes, which provides a fewmethods that can be used to create parasite axes. They aretwinx,twiny (which are similar totwinx andtwiny in the matplotlib) andtwin.twin takes an arbitrary transformation that maps between thedata coordinates of the host axes and the parasite axes. Thedrawmethod of the parasite axes are never called. Instead, host axescollects artists in parasite axes and draws them as if they belong tothe host axes, i.e., artists in parasite axes are merged to those ofthe host axes and then drawn according to their zorder. The host andparasite axes modifies some of the axes behavior. For example, colorcycle for plot lines are shared between host and parasites. Also, thelegend command in host, creates a legend that includes lines in theparasite axes. To create a host axes, you may usehost_subplot orhost_axes command.
Example 1: twinx#

Example 2: twin#
twin without a transform argument assumes that the parasite axes has thesame data transform as the host. This can be useful when you want thetop(or right)-axis to have different tick-locations, tick-labels, ortick-formatter for bottom(or left)-axis.
ax2=ax.twin()# now, ax2 is responsible for "top" axis and "right" axisax2.set_xticks([0.,.5*np.pi,np.pi,1.5*np.pi,2*np.pi],labels=["0",r"$\frac{1}{2}\pi$",r"$\pi$",r"$\frac{3}{2}\pi$",r"$2\pi$"])

A more sophisticated example using twin. Note that if you change thex-limit in the host axes, the x-limit of the parasite axes will changeaccordingly.

AnchoredArtists#
axes_grid1.anchored_artists is a collection of artists whose locationis anchored to the (axes) bbox, similarly to legends. These artists derivefromoffsetbox.OffsetBox, and the artist need to be drawn in canvascoordinates. There is limited support for arbitrary transforms. For example,the ellipse in the example below will have width and height in data coordinates.
InsetLocator#
See also
Axes.inset_axes andAxes.indicate_inset_zoom in the main library.
axes_grid1.inset_locator provides helper classes and functions toplace inset axes at an anchored position of the parent axes, similarly toAnchoredArtist.
inset_locator.inset_axes creates an inset axes whose size is either fixed,or a fixed proportion of the parent axes:
inset_axes=inset_axes(parent_axes,width="30%",# width = 30% of parent_bboxheight=1.,# height = 1 inchloc='lower left')
creates an inset axes whose width is 30% of the parent axes and whoseheight is fixed at 1 inch.
inset_locator.zoomed_inset_axes creates an inset axes whose data scale isthat of the parent axes multiplied by some factor, e.g.
inset_axes=zoomed_inset_axes(ax,0.5,# zoom = 0.5loc='upper right')
creates an inset axes whose data scale is half of the parent axes. This can beuseful to mark the zoomed area on the parent axes:

inset_locator.mark_inset allows marking the location of the area representedby the inset axes:

RGBAxes#
RGBAxes is a helper class to conveniently show RGB compositeimages. Like ImageGrid, the location of axes are adjusted so that thearea occupied by them fits in a given rectangle. Also, the xaxis andyaxis of each axes are shared.
frommpl_toolkits.axes_grid1.axes_rgbimportRGBAxesfig=plt.figure()ax=RGBAxes(fig,[0.1,0.1,0.8,0.8],pad=0.0)r,g,b=get_rgb()# r, g, b are 2D images.ax.imshow_rgb(r,g,b)

AxesDivider#
Thempl_toolkits.axes_grid1.axes_divider module provides helper classesto adjust the axes positions of a set of images at drawing time.
axes_sizeprovides a class ofunits that are used to determine the size of each axes. For example,you can specify a fixed size.Divideris the class thatcalculates the axes position. It divides the given rectangular area intoseveral areas. The divider is initialized by setting the lists of horizontaland vertical sizes on which the division will be based. Then usenew_locator(), whichreturns a callable object that can be used to set the axes_locator of theaxes.
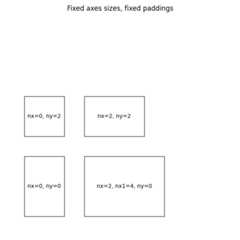
Here, we demonstrate how to achieve the following layout: we want to positionaxes in a 3x4 grid (note thatDivider makes row indices start from thebottom(!) of the grid):
┌────────┬────────┬────────┬────────┐│ (2, 0) │ (2, 1) │ (2, 2) │ (2, 3) │├────────┼────────┼────────┼────────┤│ (1, 0) │ (1, 1) │ (1, 2) │ (1, 3) │├────────┼────────┼────────┼────────┤│ (0, 0) │ (0, 1) │ (0, 2) │ (0, 3) │└────────┴────────┴────────┴────────┘
such that the bottom row has a fixed height of 2 (inches) and the top two rowshave a height ratio of 2 (middle) to 3 (top). (For example, if the grid hasa size of 7 inches, the bottom row will be 2 inches, the middle row also 2inches, and the top row 3 inches.)
These constraints are specified using classes from theaxes_size module, namely:
frommpl_toolkits.axes_grid1.axes_sizeimportFixed,Scaledvert=[Fixed(2),Scaled(2),Scaled(3)]
(More generally,axes_size classes define aget_size(renderer) method that returns a pair of floats -- a relative size,and an absolute size.Fixed(2).get_size(renderer) returns(0,2);Scaled(2).get_size(renderer) returns(2,0).)
We use these constraints to initialize aDivider object:
rect=[0.2,0.2,0.6,0.6]# Position of the grid in the figure.vert=[Fixed(2),Scaled(2),Scaled(3)]# As above.horiz=[...]# Some other horizontal constraints.divider=Divider(fig,rect,horiz,vert)
then useDivider.new_locator to create an axes locator callable for agiven grid entry:
locator=divider.new_locator(nx=0,ny=1)# Grid entry (1, 0).
and make it responsible for locating the axes:
ax.set_axes_locator(locator)
The axes locator callable returns the location and size ofthe cell at the first column and the second row.
Locators that spans over multiple cells can be created with, e.g.:
# Columns #0 and #1 ("0-2 range"), row #1.locator=divider.new_locator(nx=0,nx1=2,ny=1)
See the example,
You can also adjust the size of each axes according to its x or ydata limits (AxesX and AxesY).
