

Note
Go to the endto download the full example code.
Legend guide#
This legend guide extends thelegend docstring -please read it before proceeding with this guide.
This guide makes use of some common terms, which are documented here forclarity:
- legend entry#
A legend is made up of one or more legend entries. An entry is made upof exactly one key and one label.
- legend key#
The colored/patterned marker to the left of each legend label.
- legend label#
The text which describes the handle represented by the key.
- legend handle#
The original object which is used to generate an appropriate entry inthe legend.
Controlling the legend entries#
Callinglegend() with no arguments automatically fetches the legendhandles and their associated labels. This functionality is equivalent to:
Theget_legend_handles_labels() function returnsa list of handles/artists which exist on the Axes which can be used togenerate entries for the resulting legend - it is worth noting however thatnot all artists can be added to a legend, at which point a "proxy" will haveto be created (seeCreating artists specifically for adding to the legend (aka. Proxy artists) for further details).
Note
Artists with an empty string as label or with a label starting with anunderscore, "_", will be ignored.
For full control of what is being added to the legend, it is common to passthe appropriate handles directly tolegend():
Renaming legend entries#
When the labels cannot directly be set on the handles, they can be directly passed toAxes.legend:
If the handles are not directly accessible, for example when using someThird-party packages, they can be accessedviaAxes.get_legend_handles_labels. Here we use a dictionary to rename existinglabels:
Creating artists specifically for adding to the legend (aka. Proxy artists)#
Not all handles can be turned into legend entries automatically,so it is often necessary to create an artist whichcan. Legend handlesdon't have to exist on the Figure or Axes in order to be used.
Suppose we wanted to create a legend which has an entry for some data whichis represented by a red color:
importmatplotlib.pyplotaspltimportmatplotlib.patchesasmpatchesfig,ax=plt.subplots()red_patch=mpatches.Patch(color='red',label='The red data')ax.legend(handles=[red_patch])plt.show()

There are many supported legend handles. Instead of creating a patch of colorwe could have created a line with a marker:
importmatplotlib.linesasmlinesfig,ax=plt.subplots()blue_line=mlines.Line2D([],[],color='blue',marker='*',markersize=15,label='Blue stars')ax.legend(handles=[blue_line])plt.show()

Legend location#
The location of the legend can be specified by the keyword argumentloc. Please see the documentation atlegend() for more details.
Thebbox_to_anchor keyword gives a great degree of control for manuallegend placement. For example, if you want your Axes legend located at thefigure's top right-hand corner instead of the Axes' corner, simply specifythe corner's location and the coordinate system of that location:
More examples of custom legend placement:
fig,ax_dict=plt.subplot_mosaic([['top','top'],['bottom','BLANK']],empty_sentinel="BLANK")ax_dict['top'].plot([1,2,3],label="test1")ax_dict['top'].plot([3,2,1],label="test2")# Place a legend above this subplot, expanding itself to# fully use the given bounding box.ax_dict['top'].legend(bbox_to_anchor=(0.,1.02,1.,.102),loc='lower left',ncols=2,mode="expand",borderaxespad=0.)ax_dict['bottom'].plot([1,2,3],label="test1")ax_dict['bottom'].plot([3,2,1],label="test2")# Place a legend to the right of this smaller subplot.ax_dict['bottom'].legend(bbox_to_anchor=(1.05,1),loc='upper left',borderaxespad=0.)

Figure legends#
Sometimes it makes more sense to place a legend relative to the (sub)figurerather than individual Axes. By usingconstrained layout andspecifying "outside" at the beginning of theloc keyword argument,the legend is drawn outside the Axes on the (sub)figure.
fig,axs=plt.subplot_mosaic([['left','right']],layout='constrained')axs['left'].plot([1,2,3],label="test1")axs['left'].plot([3,2,1],label="test2")axs['right'].plot([1,2,3],'C2',label="test3")axs['right'].plot([3,2,1],'C3',label="test4")# Place a legend to the right of this smaller subplot.fig.legend(loc='outside upper right')

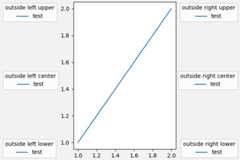
This accepts a slightly different grammar than the normalloc keyword,where "outside right upper" is different from "outside upper right".
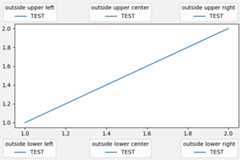
ucl=['upper','center','lower']lcr=['left','center','right']fig,ax=plt.subplots(figsize=(6,4),layout='constrained',facecolor='0.95')ax.plot([1,2],[1,2],label='TEST')# Place a legend to the right of this smaller subplot.forlocin['outside upper left','outside upper center','outside upper right','outside lower left','outside lower center','outside lower right']:fig.legend(loc=loc,title=loc)fig,ax=plt.subplots(figsize=(6,4),layout='constrained',facecolor='0.95')ax.plot([1,2],[1,2],label='test')forlocin['outside left upper','outside right upper','outside left center','outside right center','outside left lower','outside right lower']:fig.legend(loc=loc,title=loc)
Multiple legends on the same Axes#
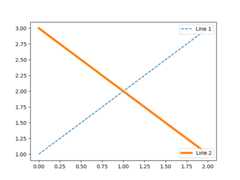
Sometimes it is more clear to split legend entries across multiplelegends. Whilst the instinctive approach to doing this might be to callthelegend() function multiple times, you will find that only onelegend ever exists on the Axes. This has been done so that it is possibleto calllegend() repeatedly to update the legend to the latesthandles on the Axes. To keep old legend instances, we must add themmanually to the Axes:
fig,ax=plt.subplots()line1,=ax.plot([1,2,3],label="Line 1",linestyle='--')line2,=ax.plot([3,2,1],label="Line 2",linewidth=4)# Create a legend for the first line.first_legend=ax.legend(handles=[line1],loc='upper right')# Add the legend manually to the Axes.ax.add_artist(first_legend)# Create another legend for the second line.ax.legend(handles=[line2],loc='lower right')plt.show()
Legend handlers#
In order to create legend entries, handles are given as an argument to anappropriateHandlerBase subclass.The choice of handler subclass is determined by the following rules:
Update
get_legend_handler_map()with the value in thehandler_mapkeyword.Check if the
handleis in the newly createdhandler_map.Check if the type of
handleis in the newly createdhandler_map.Check if any of the types in the
handle's mro is in the newlycreatedhandler_map.
For completeness, this logic is mostly implemented inget_legend_handler().
All of this flexibility means that we have the necessary hooks to implementcustom handlers for our own type of legend key.
The simplest example of using custom handlers is to instantiate one of theexistinglegend_handler.HandlerBase subclasses. For thesake of simplicity, let's chooselegend_handler.HandlerLine2Dwhich accepts anumpoints argument (numpoints is also a keywordon thelegend() function for convenience). We can then pass the mappingof instance to Handler as a keyword to legend.
frommatplotlib.legend_handlerimportHandlerLine2Dfig,ax=plt.subplots()line1,=ax.plot([3,2,1],marker='o',label='Line 1')line2,=ax.plot([1,2,3],marker='o',label='Line 2')ax.legend(handler_map={line1:HandlerLine2D(numpoints=4)},handlelength=4)
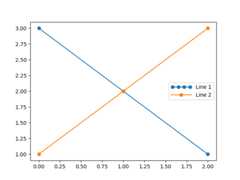
As you can see, "Line 1" now has 4 marker points, where "Line 2" has 2 (thedefault). We have also increased the length of the handles with thehandlelength keyword to fit the larger legend entry.Try the above code, only change the map's key fromline1 totype(line1). Notice how now bothLine2D instances get 4 markers.
Along with handlers for complex plot types such as errorbars, stem plotsand histograms, the defaulthandler_map has a specialtuple handler(legend_handler.HandlerTuple) which simply plots the handles on top of oneanother for each item in the given tuple. The following example demonstratescombining two legend keys on top of one another:

Thelegend_handler.HandlerTuple class can also be used toassign several legend keys to the same entry:
frommatplotlib.legend_handlerimportHandlerLine2D,HandlerTuplefig,ax=plt.subplots()p1,=ax.plot([1,2.5,3],'r-d')p2,=ax.plot([3,2,1],'k-o')l=ax.legend([(p1,p2)],['Two keys'],numpoints=1,handler_map={tuple:HandlerTuple(ndivide=None)})

Implementing a custom legend handler#
A custom handler can be implemented to turn any handle into a legend key(handles don't necessarily need to be matplotlib artists). The handler mustimplement alegend_artist method which returns a single artist for thelegend to use. The required signature forlegend_artist is documented atlegend_artist.
importmatplotlib.patchesasmpatchesclassAnyObject:passclassAnyObjectHandler:deflegend_artist(self,legend,orig_handle,fontsize,handlebox):x0,y0=handlebox.xdescent,handlebox.ydescentwidth,height=handlebox.width,handlebox.heightpatch=mpatches.Rectangle([x0,y0],width,height,facecolor='red',edgecolor='black',hatch='xx',lw=3,transform=handlebox.get_transform())handlebox.add_artist(patch)returnpatchfig,ax=plt.subplots()ax.legend([AnyObject()],['My first handler'],handler_map={AnyObject:AnyObjectHandler()})

Alternatively, had we wanted to globally acceptAnyObject instanceswithout needing to manually set thehandler_map keyword all the time, wecould have registered the new handler with:
frommatplotlib.legendimportLegendLegend.update_default_handler_map({AnyObject:AnyObjectHandler()})
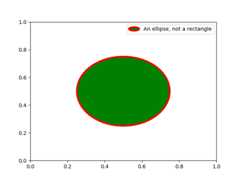
Whilst the power here is clear, remember that there are already many handlersimplemented and what you want to achieve may already be easily possible withexisting classes. For example, to produce elliptical legend keys, rather thanrectangular ones:
frommatplotlib.legend_handlerimportHandlerPatchclassHandlerEllipse(HandlerPatch):defcreate_artists(self,legend,orig_handle,xdescent,ydescent,width,height,fontsize,trans):center=0.5*width-0.5*xdescent,0.5*height-0.5*ydescentp=mpatches.Ellipse(xy=center,width=width+xdescent,height=height+ydescent)self.update_prop(p,orig_handle,legend)p.set_transform(trans)return[p]c=mpatches.Circle((0.5,0.5),0.25,facecolor="green",edgecolor="red",linewidth=3)fig,ax=plt.subplots()ax.add_patch(c)ax.legend([c],["An ellipse, not a rectangle"],handler_map={mpatches.Circle:HandlerEllipse()})
Total running time of the script: (0 minutes 5.250 seconds)