

Note
Go to the endto download the full example code.
Axis autoscaling#
The limits on an axis can be set manually (e.g.ax.set_xlim(xmin,xmax))or Matplotlib can set them automatically based on the data already on the Axes.There are a number of options to this autoscaling behaviour, discussed below.
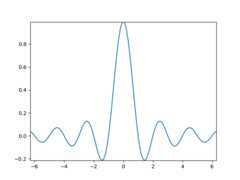
We will start with a simple line plot showing that autoscalingextends the axis limits 5% beyond the data limits (-2π, 2π).
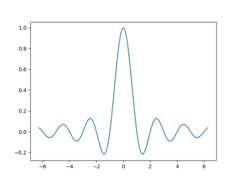
Margins#
The default margin around the data limits is 5%, which is based on thedefault configuration setting ofrcParams["axes.xmargin"] (default:0.05),rcParams["axes.ymargin"] (default:0.05),andrcParams["axes.zmargin"] (default:0.05):
print(ax.margins())
(0.05, 0.05)
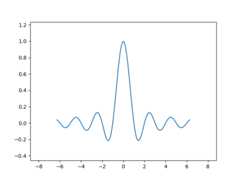
The margin size can be overridden to make them smaller or larger usingmargins:
fig,ax=plt.subplots()ax.plot(x,y)ax.margins(0.2,0.2)
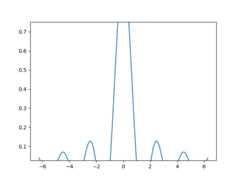
In general, margins can be in the range (-0.5, ∞), where negative margins setthe axes limits to a subrange of the data range, i.e. they clip data.Using a single number for margins affects both axes, a single margin can becustomized using keyword argumentsx ory, but positional and keywordinterface cannot be combined.
fig,ax=plt.subplots()ax.plot(x,y)ax.margins(y=-0.2)
Sticky edges#
There are plot elements (Artists) that are usually used without margins.For example false-color images (e.g. created withAxes.imshow) are notconsidered in the margins calculation.
This override of margins is determined by "sticky edges", aproperty ofArtist class that can suppress adding margins to axislimits. The effect of sticky edges can be disabled on an Axes by changinguse_sticky_edges.Artists have a propertyArtist.sticky_edges, and the values ofsticky edges can be changed by writing toArtist.sticky_edges.x orArtist.sticky_edges.y.
The following example shows how overriding works and when it is needed.
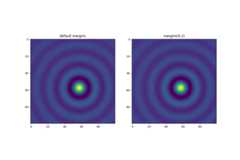
fig,ax=plt.subplots(ncols=3,figsize=(16,10))ax[0].imshow(zz)ax[0].margins(0.2)ax[0].set_title("default use_sticky_edges\nmargins(0.2)")ax[1].imshow(zz)ax[1].margins(0.2)ax[1].use_sticky_edges=Falseax[1].set_title("use_sticky_edges=False\nmargins(0.2)")ax[2].imshow(zz)ax[2].margins(-0.2)ax[2].set_title("default use_sticky_edges\nmargins(-0.2)")
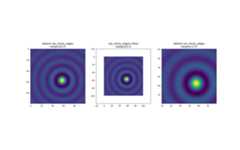
We can see that settinguse_sticky_edges toFalse renders the imagewith requested margins.
While sticky edges don't increase the axis limits through extra margins,negative margins are still taken into account. This can be seen inthe reduced limits of the third image.
Controlling autoscale#
By default, the limits arerecalculated every time you add a new curve to the plot:
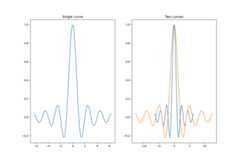
However, there are cases when you don't want to automatically adjust theviewport to new data.
One way to disable autoscaling is to manually set theaxis limit. Let's say that we want to see only a part of the data ingreater detail. Setting thexlim persists even if we add more curves tothe data. To recalculate the new limits callingAxes.autoscale willtoggle the functionality manually.
fig,ax=plt.subplots(ncols=2,figsize=(12,8))ax[0].plot(x,y)ax[0].set_xlim(left=-1,right=1)ax[0].plot(x+np.pi*0.5,y)ax[0].set_title("set_xlim(left=-1, right=1)\n")ax[1].plot(x,y)ax[1].set_xlim(left=-1,right=1)ax[1].plot(x+np.pi*0.5,y)ax[1].autoscale()ax[1].set_title("set_xlim(left=-1, right=1)\nautoscale()")
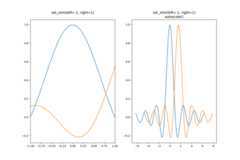
We can check that the first plot has autoscale disabled and that the secondplot has it enabled again by usingAxes.get_autoscale_on():
FalseTrue
Arguments of the autoscale function give us precise control over the processof autoscaling. A combination of argumentsenable, andaxis sets theautoscaling feature for the selected axis (or both). The argumenttightsets the margin of the selected axis to zero. To preserve settings of eitherenable ortight you can set the opposite one toNone, that wayit should not be modified. However, settingenable toNone and tighttoTrue affects both axes regardless of theaxis argument.
fig,ax=plt.subplots()ax.plot(x,y)ax.margins(0.2,0.2)ax.autoscale(enable=None,axis="x",tight=True)print(ax.margins())
(0, 0)
Total running time of the script: (0 minutes 7.258 seconds)