

Note
Go to the endto download the full example code.
Constrained layout guide#
Useconstrained layout to fit plots within your figure cleanly.
Constrained layout automatically adjusts subplots so that decorations like ticklabels, legends, and colorbars do not overlap, while still preserving thelogical layout requested by the user.
Constrained layout is similar toTightlayout, but is substantially moreflexible. It handles colorbars placed on multiple Axes(Placing colorbars) nested layouts (subfigures) and Axes thatspan rows or columns (subplot_mosaic), striving to align spines fromAxes in the same row or column. In addition,Compressed layout will try and move fixed aspect-ratio Axes closer together.These features are described in this document, as well as someimplementation details discussed at the end.
Constrained layout typically needs to be activated before any Axes are added toa figure. Two ways of doing so are
using the respective argument to
subplots,figure,subplot_mosaice.g.:plt.subplots(layout="constrained")
activate it viarcParams, like:
plt.rcParams['figure.constrained_layout.use']=True
Those are described in detail throughout the following sections.
Warning
Callingtight_layout will turn offconstrained layout!
Simple example#
With the default Axes positioning, the axes title, axis labels, or tick labelscan sometimes go outside the figure area, and thus get clipped.
importmatplotlib.pyplotaspltimportnumpyasnpimportmatplotlib.colorsasmcolorsimportmatplotlib.gridspecasgridspecplt.rcParams['savefig.facecolor']="0.8"plt.rcParams['figure.figsize']=4.5,4.plt.rcParams['figure.max_open_warning']=50defexample_plot(ax,fontsize=12,hide_labels=False):ax.plot([1,2])ax.locator_params(nbins=3)ifhide_labels:ax.set_xticklabels([])ax.set_yticklabels([])else:ax.set_xlabel('x-label',fontsize=fontsize)ax.set_ylabel('y-label',fontsize=fontsize)ax.set_title('Title',fontsize=fontsize)fig,ax=plt.subplots(layout=None)example_plot(ax,fontsize=24)
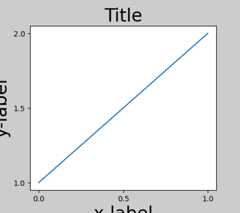
To prevent this, the location of Axes needs to be adjusted. Forsubplots, this can be done manually by adjusting the subplot parametersusingFigure.subplots_adjust. However, specifying your figure with thelayout="constrained" keyword argument will do the adjustingautomatically.
fig,ax=plt.subplots(layout="constrained")example_plot(ax,fontsize=24)

When you have multiple subplots, often you see labels of differentAxes overlapping each other.

Specifyinglayout="constrained" in the call toplt.subplotscauses the layout to be properly constrained.

Colorbars#
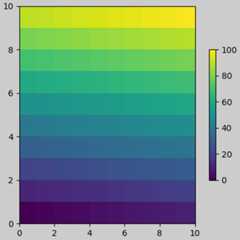
If you create a colorbar withFigure.colorbar, you need to make room forit.Constrained layout does this automatically. Note that if youspecifyuse_gridspec=True it will be ignored because this option is madefor improving the layout viatight_layout.
Note
For thepcolormesh keyword arguments (pc_kwargs) we use adictionary to keep the calls consistent across this document.
arr=np.arange(100).reshape((10,10))norm=mcolors.Normalize(vmin=0.,vmax=100.)# see note above: this makes all pcolormesh calls consistent:pc_kwargs={'rasterized':True,'cmap':'viridis','norm':norm}fig,ax=plt.subplots(figsize=(4,4),layout="constrained")im=ax.pcolormesh(arr,**pc_kwargs)fig.colorbar(im,ax=ax,shrink=0.6)
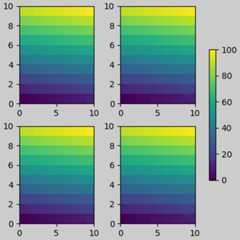
If you specify a list of Axes (or other iterable container) to theax argument ofcolorbar,constrained layout will take space fromthe specified Axes.
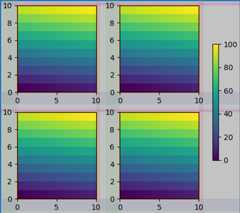
fig,axs=plt.subplots(2,2,figsize=(4,4),layout="constrained")foraxinaxs.flat:im=ax.pcolormesh(arr,**pc_kwargs)fig.colorbar(im,ax=axs,shrink=0.6)
If you specify a list of Axes from inside a grid of Axes, the colorbarwill steal space appropriately, and leave a gap, but all subplots willstill be the same size.
fig,axs=plt.subplots(3,3,figsize=(4,4),layout="constrained")foraxinaxs.flat:im=ax.pcolormesh(arr,**pc_kwargs)fig.colorbar(im,ax=axs[1:,1],shrink=0.8)fig.colorbar(im,ax=axs[:,-1],shrink=0.6)

Suptitle#
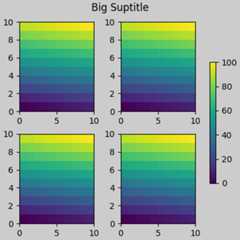
Constrained layout can also make room forsuptitle.
fig,axs=plt.subplots(2,2,figsize=(4,4),layout="constrained")foraxinaxs.flat:im=ax.pcolormesh(arr,**pc_kwargs)fig.colorbar(im,ax=axs,shrink=0.6)fig.suptitle('Big Suptitle')
Legends#
Legends can be placed outside of their parent axes.Constrained layout is designed to handle this forAxes.legend().However,constrained layout doesnot handle legends being created viaFigure.legend() (yet).

However, this will steal space from a subplot layout:
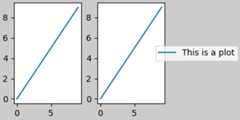
In order for a legend or other artist tonot steal spacefrom the subplot layout, we canleg.set_in_layout(False).Of course this can mean the legend ends upcropped, but can be useful if the plot is subsequently calledwithfig.savefig('outname.png',bbox_inches='tight'). Note,however, that the legend'sget_in_layout status will have to betoggled again to make the saved file work, and we must manuallytrigger a draw if we wantconstrained layout to adjust the sizeof the Axes before printing.
fig,axs=plt.subplots(1,2,figsize=(4,2),layout="constrained")axs[0].plot(np.arange(10))axs[1].plot(np.arange(10),label='This is a plot')leg=axs[1].legend(loc='center left',bbox_to_anchor=(0.8,0.5))leg.set_in_layout(False)# trigger a draw so that constrained layout is executed once# before we turn it off when printing....fig.canvas.draw()# we want the legend included in the bbox_inches='tight' calcs.leg.set_in_layout(True)# we don't want the layout to change at this point.fig.set_layout_engine('none')try:fig.savefig('../../../doc/_static/constrained_layout_1b.png',bbox_inches='tight',dpi=100)exceptFileNotFoundError:# this allows the script to keep going if run interactively and# the directory above doesn't existpass

The saved file looks like:
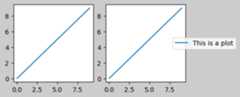
A better way to get around this awkwardness is to simplyuse the legend method provided byFigure.legend:
fig,axs=plt.subplots(1,2,figsize=(4,2),layout="constrained")axs[0].plot(np.arange(10))lines=axs[1].plot(np.arange(10),label='This is a plot')labels=[l.get_label()forlinlines]leg=fig.legend(lines,labels,loc='center left',bbox_to_anchor=(0.8,0.5),bbox_transform=axs[1].transAxes)try:fig.savefig('../../../doc/_static/constrained_layout_2b.png',bbox_inches='tight',dpi=100)exceptFileNotFoundError:# this allows the script to keep going if run interactively and# the directory above doesn't existpass
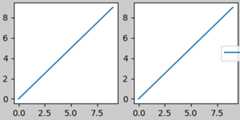
The saved file looks like:

Padding and spacing#
Padding between Axes is controlled in the horizontal byw_pad andwspace, and vertical byh_pad andhspace. These can be editedviaset.w/h_pad arethe minimum space around the Axes in units of inches:
fig,axs=plt.subplots(2,2,layout="constrained")foraxinaxs.flat:example_plot(ax,hide_labels=True)fig.get_layout_engine().set(w_pad=4/72,h_pad=4/72,hspace=0,wspace=0)
Spacing between subplots is further set bywspace andhspace. Theseare specified as a fraction of the size of the subplot group as a whole.If these values are smaller thanw_pad orh_pad, then the fixed pads areused instead. Note in the below how the space at the edges doesn't changefrom the above, but the space between subplots does.
fig,axs=plt.subplots(2,2,layout="constrained")foraxinaxs.flat:example_plot(ax,hide_labels=True)fig.get_layout_engine().set(w_pad=4/72,h_pad=4/72,hspace=0.2,wspace=0.2)

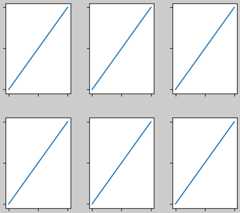
If there are more than two columns, thewspace is shared between them,so here the wspace is divided in two, with awspace of 0.1 between eachcolumn:
fig,axs=plt.subplots(2,3,layout="constrained")foraxinaxs.flat:example_plot(ax,hide_labels=True)fig.get_layout_engine().set(w_pad=4/72,h_pad=4/72,hspace=0.2,wspace=0.2)
GridSpecs also have optionalhspace andwspace keyword arguments,that will be used instead of the pads set byconstrained layout:
fig,axs=plt.subplots(2,2,layout="constrained",gridspec_kw={'wspace':0.3,'hspace':0.2})foraxinaxs.flat:example_plot(ax,hide_labels=True)# this has no effect because the space set in the gridspec trumps the# space set in *constrained layout*.fig.get_layout_engine().set(w_pad=4/72,h_pad=4/72,hspace=0.0,wspace=0.0)

Spacing with colorbars#
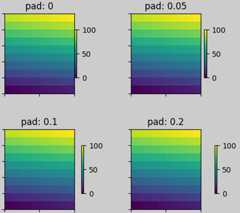
Colorbars are placed a distancepad from their parent, wherepadis a fraction of the width of the parent(s). The spacing to thenext subplot is then given byw/hspace.
fig,axs=plt.subplots(2,2,layout="constrained")pads=[0,0.05,0.1,0.2]forpad,axinzip(pads,axs.flat):pc=ax.pcolormesh(arr,**pc_kwargs)fig.colorbar(pc,ax=ax,shrink=0.6,pad=pad)ax.set_xticklabels([])ax.set_yticklabels([])ax.set_title(f'pad:{pad}')fig.get_layout_engine().set(w_pad=2/72,h_pad=2/72,hspace=0.2,wspace=0.2)
rcParams#
There are fivercParamsthat can be set, either in a script or in thematplotlibrcfile. They all have the prefixfigure.constrained_layout:
use: Whether to useconstrained layout. Default is False
w_pad,h_pad: Padding around Axes objects.Float representing inches. Default is 3./72. inches (3 pts)
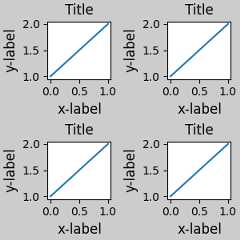
wspace,hspace: Space between subplot groups.Float representing a fraction of the subplot widths being separated.Default is 0.02.
plt.rcParams['figure.constrained_layout.use']=Truefig,axs=plt.subplots(2,2,figsize=(3,3))foraxinaxs.flat:example_plot(ax)
Use with GridSpec#
Constrained layout is meant to be usedwithsubplots(),subplot_mosaic(), orGridSpec() withadd_subplot().
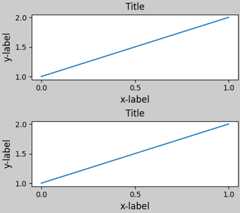
Note that in what followslayout="constrained"
plt.rcParams['figure.constrained_layout.use']=Falsefig=plt.figure(layout="constrained")gs1=gridspec.GridSpec(2,1,figure=fig)ax1=fig.add_subplot(gs1[0])ax2=fig.add_subplot(gs1[1])example_plot(ax1)example_plot(ax2)
More complicated gridspec layouts are possible. Note here we use theconvenience functionsadd_gridspec andsubgridspec.
fig=plt.figure(layout="constrained")gs0=fig.add_gridspec(1,2)gs1=gs0[0].subgridspec(2,1)ax1=fig.add_subplot(gs1[0])ax2=fig.add_subplot(gs1[1])example_plot(ax1)example_plot(ax2)gs2=gs0[1].subgridspec(3,1)forssings2:ax=fig.add_subplot(ss)example_plot(ax)ax.set_title("")ax.set_xlabel("")ax.set_xlabel("x-label",fontsize=12)

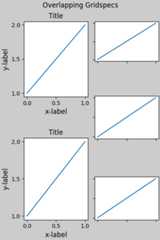
Note that in the above the left and right columns don't have the samevertical extent. If we want the top and bottom of the two grids to line upthen they need to be in the same gridspec. We need to make this figurelarger as well in order for the Axes not to collapse to zero height:
fig=plt.figure(figsize=(4,6),layout="constrained")gs0=fig.add_gridspec(6,2)ax1=fig.add_subplot(gs0[:3,0])ax2=fig.add_subplot(gs0[3:,0])example_plot(ax1)example_plot(ax2)ax=fig.add_subplot(gs0[0:2,1])example_plot(ax,hide_labels=True)ax=fig.add_subplot(gs0[2:4,1])example_plot(ax,hide_labels=True)ax=fig.add_subplot(gs0[4:,1])example_plot(ax,hide_labels=True)fig.suptitle('Overlapping Gridspecs')
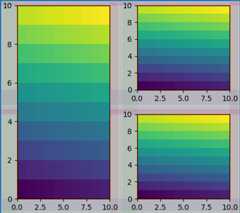
This example uses two gridspecs to have the colorbar only pertain toone set of pcolors. Note how the left column is wider than thetwo right-hand columns because of this. Of course, if you wanted thesubplots to be the same size you only needed one gridspec. Note thatthe same effect can be achieved usingsubfigures.
fig=plt.figure(layout="constrained")gs0=fig.add_gridspec(1,2,figure=fig,width_ratios=[1,2])gs_left=gs0[0].subgridspec(2,1)gs_right=gs0[1].subgridspec(2,2)forgsings_left:ax=fig.add_subplot(gs)example_plot(ax)axs=[]forgsings_right:ax=fig.add_subplot(gs)pcm=ax.pcolormesh(arr,**pc_kwargs)ax.set_xlabel('x-label')ax.set_ylabel('y-label')ax.set_title('title')axs+=[ax]fig.suptitle('Nested plots using subgridspec')fig.colorbar(pcm,ax=axs)

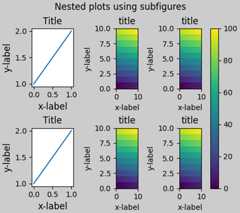
Rather than using subgridspecs, Matplotlib now providessubfigureswhich also work withconstrained layout:
fig=plt.figure(layout="constrained")sfigs=fig.subfigures(1,2,width_ratios=[1,2])axs_left=sfigs[0].subplots(2,1)foraxinaxs_left.flat:example_plot(ax)axs_right=sfigs[1].subplots(2,2)foraxinaxs_right.flat:pcm=ax.pcolormesh(arr,**pc_kwargs)ax.set_xlabel('x-label')ax.set_ylabel('y-label')ax.set_title('title')fig.colorbar(pcm,ax=axs_right)fig.suptitle('Nested plots using subfigures')
Manually setting Axes positions#
There can be good reasons to manually set an Axes position. A manual calltoset_position will set the Axes soconstrained layout hasno effect on it anymore. (Note thatconstrained layout still leaves thespace for the Axes that is moved).
fig,axs=plt.subplots(1,2,layout="constrained")example_plot(axs[0],fontsize=12)axs[1].set_position([0.2,0.2,0.4,0.4])

Grids of fixed aspect-ratio Axes: "compressed" layout#
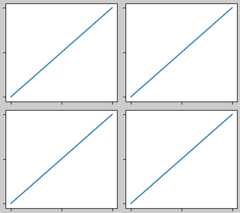
Constrained layout operates on the grid of "original" positions forAxes. However, when Axes have fixed aspect ratios, one side is usually madeshorter, and leaves large gaps in the shortened direction. In the following,the Axes are square, but the figure quite wide so there is a horizontal gap:
fig,axs=plt.subplots(2,2,figsize=(5,3),sharex=True,sharey=True,layout="constrained")foraxinaxs.flat:ax.imshow(arr)fig.suptitle("fixed-aspect plots, layout='constrained'")

One obvious way of fixing this is to make the figure size more square,however, closing the gaps exactly requires trial and error. For simple gridsof Axes we can uselayout="compressed" to do the job for us:
fig,axs=plt.subplots(2,2,figsize=(5,3),sharex=True,sharey=True,layout='compressed')foraxinaxs.flat:ax.imshow(arr)fig.suptitle("fixed-aspect plots, layout='compressed'")

Compressed layout will also attempt to size colorbars to match the size of thefixed-aspect-ratio parent Axes as the figure is resized or the aspect ratio changes.In the following figure, the colorbar is taller than its parent Axes:
fig,ax=plt.subplots(layout='constrained',figsize=(3,3))pcm=ax.imshow(np.random.randn(10,10),cmap='viridis')ax.set_title("Colorbar with layout='constrained'",fontsize='medium')fig.colorbar(pcm,ax=ax)

Compressed layout ensures that the height of the colorbar matches the heightof its parent Axes, maintaining a consistent appearance:
fig,ax=plt.subplots(layout='compressed',figsize=(3,3))pcm=ax.imshow(np.random.randn(10,10),cmap='viridis')ax.set_title("Colorbar with layout='compressed'",fontsize='medium')fig.colorbar(pcm,ax=ax)

If the Axes is zoomed in or out, or the figure is resized, the colorbar willdynamically resize to match the parent Axes. Whether this behavior is desireddepends on the specific application:
fig,ax=plt.subplots(layout='compressed',figsize=(3,3))pcm=ax.imshow(np.random.randn(10,10),cmap='viridis')ax.set_ylim([4,8])ax.set_title("Layout='compressed' with zoom",fontsize='medium')fig.colorbar(pcm,ax=ax)

Manually turning offconstrained layout#
Constrained layout usually adjusts the Axes positions on each drawof the figure. If you want to get the spacing provided byconstrained layout but not have it update, then do the initialdraw and then callfig.set_layout_engine('none').This is potentially useful for animations where the tick labels maychange length.
Note thatconstrained layout is turned off forZOOM andPANGUI events for the backends that use the toolbar. This prevents theAxes from changing position during zooming and panning.
Limitations#
Incompatible functions#
Constrained layout will work withpyplot.subplot, but only if thenumber of rows and columns is the same for each call.The reason is that each call topyplot.subplot will create a newGridSpec instance if the geometry is not the same, andconstrained layout. So the following works fine:
fig=plt.figure(layout="constrained")ax1=plt.subplot(2,2,1)ax2=plt.subplot(2,2,3)# third Axes that spans both rows in second column:ax3=plt.subplot(2,2,(2,4))example_plot(ax1)example_plot(ax2)example_plot(ax3)plt.suptitle('Homogeneous nrows, ncols')

but the following leads to a poor layout:
fig=plt.figure(layout="constrained")ax1=plt.subplot(2,2,1)ax2=plt.subplot(2,2,3)ax3=plt.subplot(1,2,2)example_plot(ax1)example_plot(ax2)example_plot(ax3)plt.suptitle('Mixed nrows, ncols')

Similarly,subplot2grid works with the same limitationthat nrows and ncols cannot change for the layout to look good.
fig=plt.figure(layout="constrained")ax1=plt.subplot2grid((3,3),(0,0))ax2=plt.subplot2grid((3,3),(0,1),colspan=2)ax3=plt.subplot2grid((3,3),(1,0),colspan=2,rowspan=2)ax4=plt.subplot2grid((3,3),(1,2),rowspan=2)example_plot(ax1)example_plot(ax2)example_plot(ax3)example_plot(ax4)fig.suptitle('subplot2grid')

Other caveats#
Constrained layout only considers ticklabels, axis labels, titles, andlegends. Thus, other artists may be clipped and also may overlap.
It assumes that the extra space needed for ticklabels, axis labels,and titles is independent of original location of Axes. This isoften true, but there are rare cases where it is not.
There are small differences in how the backends handle rendering fonts,so the results will not be pixel-identical.
An artist using Axes coordinates that extend beyond the Axesboundary will result in unusual layouts when added to anAxes. This can be avoided by adding the artist directly to the
Figureusingadd_artist(). SeeConnectionPatchfor an example.
Debugging#
Constrained layout can fail in somewhat unexpected ways. Because it usesa constraint solver the solver can find solutions that are mathematicallycorrect, but that aren't at all what the user wants. The usual failuremode is for all sizes to collapse to their smallest allowable value. Ifthis happens, it is for one of two reasons:
There was not enough room for the elements you were requesting to draw.
There is a bug - in which case open an issue atmatplotlib/matplotlib#issues.
If there is a bug, please report with a self-contained example that doesnot require outside data or dependencies (other than numpy).
Notes on the algorithm#
The algorithm for the constraint is relatively straightforward, buthas some complexity due to the complex ways we can lay out a figure.
Layout in Matplotlib is carried out with gridspecsvia theGridSpec class. A gridspec is a logical division of the figureinto rows and columns, with the relative width of the Axes in thoserows and columns set bywidth_ratios andheight_ratios.
Inconstrained layout, each gridspec gets alayoutgrid associated withit. Thelayoutgrid has a series ofleft andright variablesfor each column, andbottom andtop variables for each row, andfurther it has a margin for each of left, right, bottom and top. In eachrow, the bottom/top margins are widened until all the decoratorsin that row are accommodated. Similarly, for columns and the left/rightmargins.
Simple case: one Axes#
For a single Axes the layout is straight forward. There is one parentlayoutgrid for the figure consisting of one column and row, anda child layoutgrid for the gridspec that contains the Axes, againconsisting of one row and column. Space is made for the "decorations" oneach side of the Axes. In the code, this is accomplished by the entries indo_constrained_layout() like:
gridspec._layoutgrid[0,0].edit_margin_min('left',-bbox.x0+pos.x0+w_pad)
wherebbox is the tight bounding box of the Axes, andpos itsposition. Note how the four margins encompass the Axes decorations.
frommatplotlib._layoutgridimportplot_childrenfig,ax=plt.subplots(layout="constrained")example_plot(ax,fontsize=24)plot_children(fig)
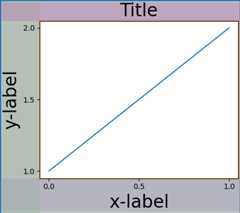
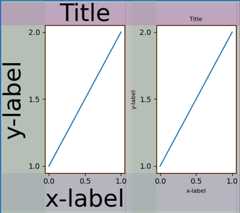
Simple case: two Axes#
When there are multiple Axes they have their layouts bound insimple ways. In this example the left Axes has much larger decorationsthan the right, but they share a bottom margin, which is made largeenough to accommodate the larger xlabel. Same with the shared topmargin. The left and right margins are not shared, and hence areallowed to be different.
Two Axes and colorbar#
A colorbar is simply another item that expands the margin of the parentlayoutgrid cell:

Colorbar associated with a Gridspec#
If a colorbar belongs to more than one cell of the grid, thenit makes a larger margin for each:
fig,axs=plt.subplots(2,2,layout="constrained")foraxinaxs.flat:im=ax.pcolormesh(arr,**pc_kwargs)fig.colorbar(im,ax=axs,shrink=0.6)plot_children(fig)
Uneven sized Axes#
There are two ways to make Axes have an uneven size in aGridspec layout, either by specifying them to cross Gridspecs rowsor columns, or by specifying width and height ratios.
The first method is used here. Note that the middletop andbottom margins are not affected by the left-hand column. Thisis a conscious decision of the algorithm, and leads to the case wherethe two right-hand Axes have the same height, but it is not 1/2 the heightof the left-hand Axes. This is consistent with howgridspec workswithoutconstrained layout.
fig=plt.figure(layout="constrained")gs=gridspec.GridSpec(2,2,figure=fig)ax=fig.add_subplot(gs[:,0])im=ax.pcolormesh(arr,**pc_kwargs)ax=fig.add_subplot(gs[0,1])im=ax.pcolormesh(arr,**pc_kwargs)ax=fig.add_subplot(gs[1,1])im=ax.pcolormesh(arr,**pc_kwargs)plot_children(fig)
One case that requires finessing is if margins do not have any artistsconstraining their width. In the case below, the right margin for column 0and the left margin for column 3 have no margin artists to set their width,so we take the maximum width of the margin widths that do have artists.This makes all the Axes have the same size:
fig=plt.figure(layout="constrained")gs=fig.add_gridspec(2,4)ax00=fig.add_subplot(gs[0,0:2])ax01=fig.add_subplot(gs[0,2:])ax10=fig.add_subplot(gs[1,1:3])example_plot(ax10,fontsize=14)plot_children(fig)plt.show()

Total running time of the script: (0 minutes 23.045 seconds)