

Note
Go to the endto download the full example code.
Axis ticks#
The x and y Axis on each Axes have default tick "locators" and "formatters"that depend on the scale being used (seeAxis scales). It ispossible to customize the ticks and tick labels with either high-level methodslikeset_xticks or set the locators and formatters directly onthe axis.
Manual location and formats#
The simplest method to customize the tick locations and formats is to useset_xticks andset_yticks. These can be used oneither the major or the minor ticks.
importnumpyasnpimportmatplotlib.pyplotaspltimportmatplotlib.tickerastickerfig,axs=plt.subplots(2,1,figsize=(5.4,5.4),layout='constrained')x=np.arange(100)fornn,axinenumerate(axs):ax.plot(x,x)ifnn==1:ax.set_title('Manual ticks')ax.set_yticks(np.arange(0,100.1,100/3))xticks=np.arange(0.50,101,20)xlabels=[f'\\${x:1.2f}'forxinxticks]ax.set_xticks(xticks,labels=xlabels)else:ax.set_title('Automatic ticks')

Note that the length of thelabels argument must have the same length asthe array used to specify the ticks.
By defaultset_xticks andset_yticks act on themajor ticks of an Axis, however it is possible to add minor ticks:
fig,axs=plt.subplots(2,1,figsize=(5.4,5.4),layout='constrained')x=np.arange(100)fornn,axinenumerate(axs):ax.plot(x,x)ifnn==1:ax.set_title('Manual ticks')ax.set_yticks(np.arange(0,100.1,100/3))ax.set_yticks(np.arange(0,100.1,100/30),minor=True)else:ax.set_title('Automatic ticks')

Locators and Formatters#
Manually setting the ticks as above works well for specific final plots, butdoes not adapt as the user interacts with the Axes. At a lower level,Matplotlib hasLocators that are meant to automatically choose ticksdepending on the current view limits of the axis, andFormatters that aremeant to format the tick labels automatically.
The full list of locators provided by Matplotlib are listed atTick locating, and the formatters atTick formatting.
defsetup(ax,title):"""Set up common parameters for the Axes in the example."""# only show the bottom spineax.yaxis.set_major_locator(ticker.NullLocator())ax.spines[['left','right','top']].set_visible(False)ax.xaxis.set_ticks_position('bottom')ax.tick_params(which='major',width=1.00,length=5)ax.tick_params(which='minor',width=0.75,length=2.5)ax.set_xlim(0,5)ax.set_ylim(0,1)ax.text(0.0,0.2,title,transform=ax.transAxes,fontsize=14,fontname='Monospace',color='tab:blue')fig,axs=plt.subplots(8,1,layout='constrained')# Null Locatorsetup(axs[0],title="NullLocator()")axs[0].xaxis.set_major_locator(ticker.NullLocator())axs[0].xaxis.set_minor_locator(ticker.NullLocator())# Multiple Locatorsetup(axs[1],title="MultipleLocator(0.5)")axs[1].xaxis.set_major_locator(ticker.MultipleLocator(0.5))axs[1].xaxis.set_minor_locator(ticker.MultipleLocator(0.1))# Fixed Locatorsetup(axs[2],title="FixedLocator([0, 1, 5])")axs[2].xaxis.set_major_locator(ticker.FixedLocator([0,1,5]))axs[2].xaxis.set_minor_locator(ticker.FixedLocator(np.linspace(0.2,0.8,4)))# Linear Locatorsetup(axs[3],title="LinearLocator(numticks=3)")axs[3].xaxis.set_major_locator(ticker.LinearLocator(3))axs[3].xaxis.set_minor_locator(ticker.LinearLocator(31))# Index Locatorsetup(axs[4],title="IndexLocator(base=0.5, offset=0.25)")axs[4].plot(range(0,5),[0]*5,color='white')axs[4].xaxis.set_major_locator(ticker.IndexLocator(base=0.5,offset=0.25))# Auto Locatorsetup(axs[5],title="AutoLocator()")axs[5].xaxis.set_major_locator(ticker.AutoLocator())axs[5].xaxis.set_minor_locator(ticker.AutoMinorLocator())# MaxN Locatorsetup(axs[6],title="MaxNLocator(n=4)")axs[6].xaxis.set_major_locator(ticker.MaxNLocator(4))axs[6].xaxis.set_minor_locator(ticker.MaxNLocator(40))# Log Locatorsetup(axs[7],title="LogLocator(base=10, numticks=15)")axs[7].set_xlim(10**3,10**10)axs[7].set_xscale('log')axs[7].xaxis.set_major_locator(ticker.LogLocator(base=10,numticks=15))plt.show()

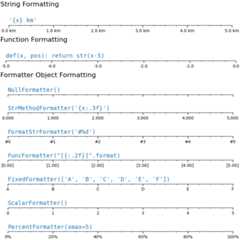
Similarly, we can specify "Formatters" for the major and minor ticks on eachaxis.
The tick format is configured via the functionset_major_formatterorset_minor_formatter. It accepts:
a format string, which implicitly creates a
StrMethodFormatter.a function, implicitly creates a
FuncFormatter.an instance of a
Formattersubclass. The most common areNullFormatter: No labels on the ticks.StrMethodFormatter: Use stringstr.formatmethod.FormatStrFormatter: Use %-style formatting.FuncFormatter: Define labels through a function.FixedFormatter: Set the label strings explicitly.ScalarFormatter: Default formatter for scalars: auto-pick the format string.PercentFormatter: Format labels as a percentage.
SeeTick formatting for the complete list.
defsetup(ax,title):"""Set up common parameters for the Axes in the example."""# only show the bottom spineax.yaxis.set_major_locator(ticker.NullLocator())ax.spines[['left','right','top']].set_visible(False)# define tick positionsax.xaxis.set_major_locator(ticker.MultipleLocator(1.00))ax.xaxis.set_minor_locator(ticker.MultipleLocator(0.25))ax.xaxis.set_ticks_position('bottom')ax.tick_params(which='major',width=1.00,length=5)ax.tick_params(which='minor',width=0.75,length=2.5,labelsize=10)ax.set_xlim(0,5)ax.set_ylim(0,1)ax.text(0.0,0.2,title,transform=ax.transAxes,fontsize=14,fontname='Monospace',color='tab:blue')fig=plt.figure(figsize=(8,8),layout='constrained')fig0,fig1,fig2=fig.subfigures(3,height_ratios=[1.5,1.5,7.5])fig0.suptitle('String Formatting',fontsize=16,x=0,ha='left')ax0=fig0.subplots()setup(ax0,title="'{x} km'")ax0.xaxis.set_major_formatter('{x} km')fig1.suptitle('Function Formatting',fontsize=16,x=0,ha='left')ax1=fig1.subplots()setup(ax1,title="def(x, pos): return str(x-5)")ax1.xaxis.set_major_formatter(lambdax,pos:str(x-5))fig2.suptitle('Formatter Object Formatting',fontsize=16,x=0,ha='left')axs2=fig2.subplots(7,1)setup(axs2[0],title="NullFormatter()")axs2[0].xaxis.set_major_formatter(ticker.NullFormatter())setup(axs2[1],title="StrMethodFormatter('{x:.3f}')")axs2[1].xaxis.set_major_formatter(ticker.StrMethodFormatter("{x:.3f}"))setup(axs2[2],title="FormatStrFormatter('#%d')")axs2[2].xaxis.set_major_formatter(ticker.FormatStrFormatter("#%d"))deffmt_two_digits(x,pos):returnf'[{x:.2f}]'setup(axs2[3],title='FuncFormatter("[{:.2f}]".format)')axs2[3].xaxis.set_major_formatter(ticker.FuncFormatter(fmt_two_digits))setup(axs2[4],title="FixedFormatter(['A', 'B', 'C', 'D', 'E', 'F'])")# FixedFormatter should only be used together with FixedLocator.# Otherwise, one cannot be sure where the labels will end up.positions=[0,1,2,3,4,5]labels=['A','B','C','D','E','F']axs2[4].xaxis.set_major_locator(ticker.FixedLocator(positions))axs2[4].xaxis.set_major_formatter(ticker.FixedFormatter(labels))setup(axs2[5],title="ScalarFormatter()")axs2[5].xaxis.set_major_formatter(ticker.ScalarFormatter(useMathText=True))setup(axs2[6],title="PercentFormatter(xmax=5)")axs2[6].xaxis.set_major_formatter(ticker.PercentFormatter(xmax=5))
Styling ticks (tick parameters)#
The appearance of ticks can be controlled at a low level by finding theindividualTick on the axis. However, usually it is simplest tousetick_params to change all the objects at once.
Thetick_params method can change the properties of ticks:
length
direction (in or out of the frame)
colors
width and length
and whether the ticks are drawn at the bottom, top, left, or right of theAxes.
It also can control the tick labels:
labelsize (fontsize)
labelcolor (color of the label)
labelrotation
labelbottom, labeltop, labelleft, labelright
In addition there is apad keyword argument that specifies how far the ticklabel is from the tick.
Finally, the grid linestyles can be set:
grid_color
grid_alpha
grid_linewidth
grid_linestyle
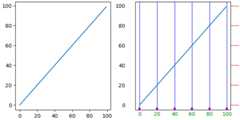
All these properties can be restricted to one axis, and can be applied tojust the major or minor ticks
fig,axs=plt.subplots(1,2,figsize=(6.4,3.2),layout='constrained')fornn,axinenumerate(axs):ax.plot(np.arange(100))ifnn==1:ax.grid('on')ax.tick_params(right=True,left=False,axis='y',color='r',length=16,grid_color='none')ax.tick_params(axis='x',color='m',length=4,direction='in',width=4,labelcolor='g',grid_color='b')
Total running time of the script: (0 minutes 5.318 seconds)