

Note
Go to the endto download the full example code.
Axis scales#
By default Matplotlib displays data on the axis using a linear scale.Matplotlib also supportslogarithmic scales, and other less commonscales as well. Usually this can be done directly by using theset_xscale orset_yscale methods.
importmatplotlib.pyplotaspltimportnumpyasnpimportmatplotlib.scaleasmscalefrommatplotlib.tickerimportFixedLocator,NullFormatterfig,axs=plt.subplot_mosaic([['linear','linear-log'],['log-linear','log-log']],layout='constrained')x=np.arange(0,3*np.pi,0.1)y=2*np.sin(x)+3ax=axs['linear']ax.plot(x,y)ax.set_xlabel('linear')ax.set_ylabel('linear')ax=axs['linear-log']ax.plot(x,y)ax.set_yscale('log')ax.set_xlabel('linear')ax.set_ylabel('log')ax=axs['log-linear']ax.plot(x,y)ax.set_xscale('log')ax.set_xlabel('log')ax.set_ylabel('linear')ax=axs['log-log']ax.plot(x,y)ax.set_xscale('log')ax.set_yscale('log')ax.set_xlabel('log')ax.set_ylabel('log')

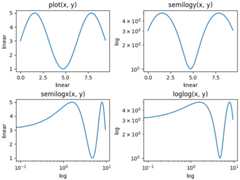
loglog and semilogx/y#
The logarithmic axis is used so often that there are a sethelper functions, that do the same thing:semilogy,semilogx, andloglog.
fig,axs=plt.subplot_mosaic([['linear','linear-log'],['log-linear','log-log']],layout='constrained')x=np.arange(0,3*np.pi,0.1)y=2*np.sin(x)+3ax=axs['linear']ax.plot(x,y)ax.set_xlabel('linear')ax.set_ylabel('linear')ax.set_title('plot(x, y)')ax=axs['linear-log']ax.semilogy(x,y)ax.set_xlabel('linear')ax.set_ylabel('log')ax.set_title('semilogy(x, y)')ax=axs['log-linear']ax.semilogx(x,y)ax.set_xlabel('log')ax.set_ylabel('linear')ax.set_title('semilogx(x, y)')ax=axs['log-log']ax.loglog(x,y)ax.set_xlabel('log')ax.set_ylabel('log')ax.set_title('loglog(x, y)')
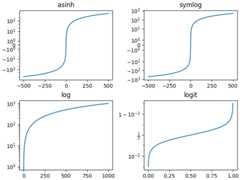
Other built-in scales#
There are other scales that can be used. The list of registeredscales can be returned fromscale.get_scale_names:
print(mscale.get_scale_names())
['asinh', 'function', 'functionlog', 'linear', 'log', 'logit', 'symlog']
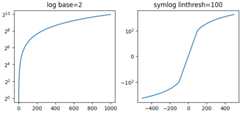
Optional arguments for scales#
Some of the default scales have optional arguments. These aredocumented in the API reference for the respective scales atscale. One can change the base of the logarithmbeing plotted (eg 2 below) or the linear threshold rangefor'symlog'.
fig,axs=plt.subplot_mosaic([['log','symlog']],layout='constrained',figsize=(6.4,3))forname,axinaxs.items():ifnamein['log']:ax.plot(x,x)ax.set_yscale('log',base=2)ax.set_title('log base=2')else:ax.plot(x-np.mean(x),x-np.mean(x))ax.set_yscale('symlog',linthresh=100)ax.set_title('symlog linthresh=100')
Arbitrary function scales#
Users can define a full scale class and pass that toset_xscaleandset_yscale (seeCustom scale). A short cut for thisis to use the 'function' scale, and pass as extra arguments aforward andaninverse function. The following performs aMercator transform to the y-axis.
# Function Mercator transformdefforward(a):a=np.deg2rad(a)returnnp.rad2deg(np.log(np.abs(np.tan(a)+1.0/np.cos(a))))definverse(a):a=np.deg2rad(a)returnnp.rad2deg(np.arctan(np.sinh(a)))t=np.arange(0,170.0,0.1)s=t/2.fig,ax=plt.subplots(layout='constrained')ax.plot(t,s,'-',lw=2)ax.set_yscale('function',functions=(forward,inverse))ax.set_title('function: Mercator')ax.grid(True)ax.set_xlim(0,180)ax.yaxis.set_minor_formatter(NullFormatter())ax.yaxis.set_major_locator(FixedLocator(np.arange(0,90,10)))

What is a "scale"?#
A scale is an object that gets attached to an axis. The class documentationis atscale.set_xscale andset_yscaleset the scale on the respective Axis objects. You can determine the scaleon an axis withget_scale:
fig,ax=plt.subplots(layout='constrained',figsize=(3.2,3))ax.semilogy(x,x)print(ax.xaxis.get_scale())print(ax.yaxis.get_scale())
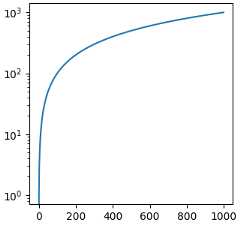
linearlog
Setting a scale does three things. First it defines a transform on the axisthat maps between data values to position along the axis. This transform canbe accessed viaget_transform:
print(ax.yaxis.get_transform())
LogTransform(base=10, nonpositive='clip')
Transforms on the axis are a relatively low-level concept, but is one of theimportant roles played byset_scale.
Setting the scale also sets default tick locators (ticker) and tickformatters appropriate for the scale. An axis with a 'log' scale has aLogLocator to pick ticks at decade intervals, and aLogFormatter to use scientific notation on the decades.
print('X axis')print(ax.xaxis.get_major_locator())print(ax.xaxis.get_major_formatter())print('Y axis')print(ax.yaxis.get_major_locator())print(ax.yaxis.get_major_formatter())
X axis<matplotlib.ticker.AutoLocator object at 0x7f49d8a180e0><matplotlib.ticker.ScalarFormatter object at 0x7f49d8a1ab40>Y axis<matplotlib.ticker.LogLocator object at 0x7f49d906f8c0><matplotlib.ticker.LogFormatterSciNotation object at 0x7f49d8ce7c50>
Total running time of the script: (0 minutes 5.469 seconds)