

The axisartist toolkit#
Warning
axisartist uses a custom Axes class(derived from the Matplotlib's original Axes class).As a side effect, some commands (mostly tick-related) do not work.
Theaxisartist contains a custom Axes class that is meant to supportcurvilinear grids (e.g., the world coordinate system in astronomy).Unlike Matplotlib's original Axes class which uses Axes.xaxis and Axes.yaxisto draw ticks, ticklines, etc., axisartist uses a specialartist (AxisArtist) that can handle ticks, ticklines, etc. forcurved coordinate systems.

Since it uses special artists, some Matplotlib commands that work onAxes.xaxis and Axes.yaxis may not work.
axisartist#
Theaxisartist module provides a custom (and very experimental) Axesclass, where each axis (left, right, top, and bottom) have a separateassociated artist which is responsible for drawing the axis-line, ticks,ticklabels, and labels. You can also create your own axis, which can passthrough a fixed position in the axes coordinate, or a fixed positionin the data coordinate (i.e., the axis floats around when viewlimitchanges).
The axes class, by default, has its xaxis and yaxis invisible, andhas 4 additional artists which are responsible for drawing the 4 axis spines in"left", "right", "bottom", and "top". They are accessed asax.axis["left"], ax.axis["right"], and so on, i.e., ax.axis is adictionary that contains artists (note that ax.axis is still acallable method and it behaves as an original Axes.axis method inMatplotlib).
To create an Axes,
importmpl_toolkits.axisartistasAAfig=plt.figure()fig.add_axes((0.1,0.1,0.8,0.8),axes_class=AA.Axes)
or to create a subplot
fig.add_subplot(111,axes_class=AA.Axes)# Given that 111 is the default, one can also dofig.add_subplot(axes_class=AA.Axes)
For example, you can hide the right and top spines using:
ax.axis["right"].set_visible(False)ax.axis["top"].set_visible(False)

It is also possible to add a horizontal axis. For example, you may have anhorizontal axis at y=0 (in data coordinate).
ax.axis["y=0"]=ax.new_floating_axis(nth_coord=0,value=0)

Or a fixed axis with some offset
# make new (right-side) yaxis, but with some offsetax.axis["right2"]=ax.new_fixed_axis(loc="right",offset=(20,0))
axisartist with ParasiteAxes#
Most commands in the axes_grid1 toolkit can take an axes_class keywordargument, and the commands create an Axes of the given class. For example,to create a host subplot with axisartist.Axes,
importmpl_toolkits.axisartistasAAfrommpl_toolkits.axes_grid1importhost_subplothost=host_subplot(111,axes_class=AA.Axes)
Here is an example that uses ParasiteAxes.

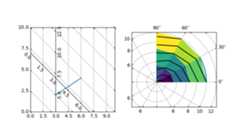
Curvilinear grid#
The motivation behind the AxisArtist module is to support a curvilinear gridand ticks.
Floating Axes#
AxisArtist also supports a Floating Axes whose outer axes are defined asfloating axis.

axisartist namespace#
Theaxisartist namespace includes a derived Axes implementation. Thebiggest difference is that the artists responsible to draw axis line,ticks, ticklabel and axis labels are separated out from the Matplotlib's Axisclass, which are much more than artists in the original Matplotlib. Thischange was strongly motivated to support curvilinear grid. Here are afew things that mpl_toolkits.axisartist.Axes is different from originalAxes from Matplotlib.
Axis elements (axis line(spine), ticks, ticklabel and axis labels)are drawn by a AxisArtist instance. Unlike Axis, left, right, topand bottom axis are drawn by separate artists. And each of them mayhave different tick location and different tick labels.
gridlines are drawn by a Gridlines instance. The change wasmotivated that in curvilinear coordinate, a gridline may not crossaxis-lines (i.e., no associated ticks). In the original Axes class,gridlines are tied to ticks.
ticklines can be rotated if necessary (i.e, along the gridlines)
In summary, all these changes was to support
a curvilinear grid.
a floating axis
mpl_toolkits.axisartist.Axes class defines aaxis attribute, whichis a dictionary of AxisArtist instances. By default, the dictionaryhas 4 AxisArtist instances, responsible for drawing of left, right,bottom and top axis.
xaxis and yaxis attributes are still available, however they are setto not visible. As separate artists are used for rendering axis, someaxis-related method in Matplotlib may have no effect.In addition to AxisArtist instances, the mpl_toolkits.axisartist.Axes willhavegridlines attribute (Gridlines), which obviously draws gridlines.
In both AxisArtist and Gridlines, the calculation of tick and gridlocation is delegated to an instance of GridHelper class.mpl_toolkits.axisartist.Axes class uses GridHelperRectlinear as a gridhelper. The GridHelperRectlinear class is a wrapper around thexaxisandyaxis of Matplotlib's original Axes, and it was meant to work as theway how Matplotlib's original axes works. For example, tick location changesusing set_ticks method and etc. should work as expected. But change inartist properties (e.g., color) will not work in general, althoughsome effort has been made so that some often-change attributes (color,etc.) are respected.
AxisArtist#
AxisArtist can be considered as a container artist with followingattributes which will draw ticks, labels, etc.
line
major_ticks, major_ticklabels
minor_ticks, minor_ticklabels
offsetText
label
line#
Derived from Line2D class. Responsible for drawing a spinal(?) line.
major_ticks, minor_ticks#
Derived from Line2D class. Note that ticks are markers.
major_ticklabels, minor_ticklabels#
Derived from Text. Note that it is not a list of Text artist, but asingle artist (similar to a collection).
axislabel#
Derived from Text.
Default AxisArtists#
By default, following for axis artists are defined.:
ax.axis["left"],ax.axis["bottom"],ax.axis["right"],ax.axis["top"]
The ticklabels and axislabel of the top and the right axis are set tonot visible.
For example, if you want to change the color attributes ofmajor_ticklabels of the bottom x-axis
ax.axis["bottom"].major_ticklabels.set_color("b")
Similarly, to make ticklabels invisible
ax.axis["bottom"].major_ticklabels.set_visible(False)
AxisArtist provides a helper method to control the visibility of ticks,ticklabels, and label. To make ticklabel invisible,
ax.axis["bottom"].toggle(ticklabels=False)
To make all of ticks, ticklabels, and (axis) label invisible
ax.axis["bottom"].toggle(all=False)
To turn all off but ticks on
ax.axis["bottom"].toggle(all=False,ticks=True)
To turn all on but (axis) label off
ax.axis["bottom"].toggle(all=True,label=False)
ax.axis's __getitem__ method can take multiple axis names. Forexample, to turn ticklabels of "top" and "right" axis on,
ax.axis["top","right"].toggle(ticklabels=True)
Note thatax.axis["top","right"] returns a simple proxy object thattranslate above code to something like below.
fornin["top","right"]:ax.axis[n].toggle(ticklabels=True)
So, any return values in the for loop are ignored. And you should notuse it anything more than a simple method.
Like the list indexing ":" means all items, i.e.,
ax.axis[:].major_ticks.set_color("r")
changes tick color in all axis.
HowTo#
Changing tick locations and label.
Same as the original Matplotlib's axes:
ax.set_xticks([1,2,3])
Changing axis properties like color, etc.
Change the properties of appropriate artists. For example, to changethe color of the ticklabels:
ax.axis["left"].major_ticklabels.set_color("r")
To change the attributes of multiple axis:
ax.axis["left","bottom"].major_ticklabels.set_color("r")
or to change the attributes of all axis:
ax.axis[:].major_ticklabels.set_color("r")
To change the tick size (length), you need to useaxis.major_ticks.set_ticksize method. To change the direction ofthe ticks (ticks are in opposite direction of ticklabels bydefault), use axis.major_ticks.set_tick_out method.
To change the pad between ticks and ticklabels, useaxis.major_ticklabels.set_pad method.
To change the pad between ticklabels and axis label,axis.label.set_pad method.
Rotation and alignment of TickLabels#
This is also quite different from standard Matplotlib and can beconfusing. When you want to rotate the ticklabels, first considerusing "set_axis_direction" method.
ax1.axis["left"].major_ticklabels.set_axis_direction("top")ax1.axis["right"].label.set_axis_direction("left")

The parameter for set_axis_direction is one of ["left", "right","bottom", "top"].
You must understand some underlying concept of directions.
There is a reference direction which is defined as the directionof the axis line with increasing coordinate. For example, thereference direction of the left x-axis is from bottom to top.
The direction, text angle, and alignments of the ticks, ticklabels andaxis-label is determined with respect to the reference direction
label_direction andticklabel_direction are either the right-hand side(+) of the reference direction or the left-hand side (-).
ticks are by default drawn toward the opposite direction of the ticklabels.
text rotation of ticklabels and label is determined in referenceto theticklabel_direction orlabel_direction,respectively. The rotation of ticklabels and label is anchored.

On the other hand, there is a concept of "axis_direction". This is adefault setting of above properties for each, "bottom", "left", "top",and "right" axis.
reference direction | label direction | label rotation | horizontal alignment | vertical alignment |
|---|---|---|---|---|
left | '-' | 180 | right | center |
bottom | '+' | 0 | center | top |
right | '+' | 0 | right | center |
top | '-' | 180 | center | bottom |
reference direction | label direction | label rotation | horizontal alignment | vertical alignment |
|---|---|---|---|---|
left | '-' | 90 | right | center |
bottom | '+' | 0 | center | baseline |
right | '+' | -90 | right | center |
top | '-' | 180 | center | baseline |
And, 'set_axis_direction("top")' means to adjust the text rotationetc, for settings suitable for "top" axis. The concept of axisdirection can be more clear with curved axis.

The axis_direction can be adjusted in the AxisArtist level, or in thelevel of its child artists, i.e., ticks, ticklabels, and axis-label.
ax1.axis["left"].set_axis_direction("top")
changes axis_direction of all the associated artist with the "left"axis, while
ax1.axis["left"].major_ticklabels.set_axis_direction("top")
changes the axis_direction of only the major_ticklabels. Note thatset_axis_direction in the AxisArtist level changes theticklabel_direction and label_direction, while changing theaxis_direction of ticks, ticklabels, and axis-label does not affectthem.
If you want to make ticks outward and ticklabels inside the axes,use invert_ticklabel_direction method.
ax.axis[:].invert_ticklabel_direction()
A related method is "set_tick_out". It makes ticks outward (as amatter of fact, it makes ticks toward the opposite direction of thedefault direction).
ax.axis[:].major_ticks.set_tick_out(True)

So, in summary,
AxisArtist's methods
set_axis_direction: "left", "right", "bottom", or "top"
set_ticklabel_direction: "+" or "-"
set_axislabel_direction: "+" or "-"
invert_ticklabel_direction
Ticks' methods (major_ticks and minor_ticks)
set_tick_out: True or False
set_ticksize: size in points
TickLabels' methods (major_ticklabels and minor_ticklabels)
set_axis_direction: "left", "right", "bottom", or "top"
set_rotation: angle with respect to the reference direction
set_ha and set_va: see below
AxisLabels' methods (label)
set_axis_direction: "left", "right", "bottom", or "top"
set_rotation: angle with respect to the reference direction
set_ha and set_va
Adjusting ticklabels alignment#
Alignment of TickLabels are treated specially. See below

Adjusting pad#
To change the pad between ticks and ticklabels
ax.axis["left"].major_ticklabels.set_pad(10)
Or ticklabels and axis-label
ax.axis["left"].label.set_pad(10)

GridHelper#
To actually define a curvilinear coordinate, you have to use your owngrid helper. A generalised version of grid helper class is suppliedand this class should suffice in most of cases. A user may providetwo functions which defines a transformation (and its inverse pair)from the curved coordinate to (rectilinear) image coordinate. Note thatwhile ticks and grids are drawn for curved coordinate, the datatransform of the axes itself (ax.transData) is still rectilinear(image) coordinate.
frommpl_toolkits.axisartist.grid_helper_curvelinear \importGridHelperCurveLinearfrommpl_toolkits.axisartistimportAxes# from curved coordinate to rectlinear coordinate.deftr(x,y):x,y=np.asarray(x),np.asarray(y)returnx,y-x# from rectlinear coordinate to curved coordinate.definv_tr(x,y):x,y=np.asarray(x),np.asarray(y)returnx,y+xgrid_helper=GridHelperCurveLinear((tr,inv_tr))fig.add_subplot(axes_class=Axes,grid_helper=grid_helper)
You may use Matplotlib's Transform instance instead (but ainverse transformation must be defined). Often, coordinate range in acurved coordinate system may have a limited range, or may havecycles. In those cases, a more customized version of grid helper isrequired.
importmpl_toolkits.axisartist.angle_helperasangle_helper# PolarAxes.PolarTransform takes radian. However, we want our coordinate# system in degreetr=Affine2D().scale(np.pi/180.,1.)+PolarAxes.PolarTransform()# extreme finder: find a range of coordinate.# 20, 20: number of sampling points along x, y direction# The first coordinate (longitude, but theta in polar)# has a cycle of 360 degree.# The second coordinate (latitude, but radius in polar) has a minimum of 0extreme_finder=angle_helper.ExtremeFinderCycle(20,20,lon_cycle=360,lat_cycle=None,lon_minmax=None,lat_minmax=(0,np.inf),)# Find a grid values appropriate for the coordinate (degree,# minute, second). The argument is a approximate number of grids.grid_locator1=angle_helper.LocatorDMS(12)# And also uses an appropriate formatter. Note that the acceptable Locator# and Formatter classes are different than that of Matplotlib's, and you# cannot directly use Matplotlib's Locator and Formatter here (but may be# possible in the future).tick_formatter1=angle_helper.FormatterDMS()grid_helper=GridHelperCurveLinear(tr,extreme_finder=extreme_finder,grid_locator1=grid_locator1,tick_formatter1=tick_formatter1)
Again, thetransData of the axes is still a rectilinear coordinate(image coordinate). You may manually do conversion between twocoordinates, or you may use Parasite Axes for convenience.:
ax1=SubplotHost(fig,1,2,2,grid_helper=grid_helper)# A parasite axes with given transformax2=ax1.get_aux_axes(tr,"equal")# note that ax2.transData == tr + ax1.transData# Anything you draw in ax2 will match the ticks and grids of ax1.
FloatingAxis#
A floating axis is an axis one of whose data coordinate is fixed, i.e,its location is not fixed in Axes coordinate but changes as axes datalimits changes. A floating axis can be created usingnew_floating_axis method. However, it is your responsibility thatthe resulting AxisArtist is properly added to the axes. A recommendedway is to add it as an item of Axes's axis attribute.:
# floating axis whose first (index starts from 0) coordinate# (theta) is fixed at 60ax1.axis["lat"]=axis=ax1.new_floating_axis(0,60)axis.label.set_text(r"$\theta = 60^{\circ}$")axis.label.set_visible(True)
See the first example of this page.
Current limitations and TODO's#
The code need more refinement. Here is a incomplete list of issues and TODO's
No easy way to support a user customized tick location (forcurvilinear grid). A new Locator class needs to be created.
FloatingAxis may have coordinate limits, e.g., a floating axis of x = 0,but y only spans from 0 to 1.
The location of axislabel of FloatingAxis needs to be optionallygiven as a coordinate value. ex, a floating axis of x=0 with label at y=1