

Note
Go to the endto download the full example code.
Manual Contour#
Example of displaying your own contour lines and polygons using ContourSet.
importmatplotlib.pyplotaspltfrommatplotlib.contourimportContourSetfrommatplotlib.pathimportPath
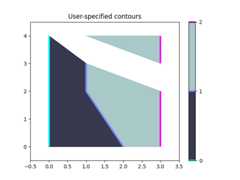
Contour lines for each level are a list/tuple of polygons.
Filled contours between two levels are also a list/tuple of polygons.Points can be ordered clockwise or anticlockwise.
fig,ax=plt.subplots()# Filled contours using filled=True.cs=ContourSet(ax,[0,1,2],[filled01,filled12],filled=True,cmap="bone")cbar=fig.colorbar(cs)# Contour lines (non-filled).lines=ContourSet(ax,[0,1,2],[lines0,lines1,lines2],cmap="cool",linewidths=3)cbar.add_lines(lines)ax.set(xlim=(-0.5,3.5),ylim=(-0.5,4.5),title='User-specified contours')
Multiple filled contour lines can be specified in a single list of polygonvertices along with a list of vertex kinds (code types) as described in thePath class. This is particularly useful for polygons with holes.
fig,ax=plt.subplots()filled01=[[[0,0],[3,0],[3,3],[0,3],[1,1],[1,2],[2,2],[2,1]]]M=Path.MOVETOL=Path.LINETOkinds01=[[M,L,L,L,M,L,L,L]]cs=ContourSet(ax,[0,1],[filled01],[kinds01],filled=True)cbar=fig.colorbar(cs)ax.set(xlim=(-0.5,3.5),ylim=(-0.5,3.5),title='User specified filled contours with holes')plt.show()
