

Note
Go to the endto download the full example code.
Major and minor ticks#
Demonstrate how to use major and minor tickers.
The two relevant classes areLocators andFormatters. Locatorsdetermine where the ticks are, and formatters control the formatting of ticklabels.
Minor ticks are off by default (usingNullLocator andNullFormatter).Minor ticks can be turned on without labels by setting the minor locator.Minor tick labels can be turned on by setting the minor formatter.
MultipleLocator places ticks on multiples of some base.StrMethodFormatter uses a format string (e.g.,'{x:d}' or'{x:1.2f}'or'{x:1.1f}cm') to format the tick labels (the variable in the formatstring must be'x'). For aStrMethodFormatter, the string can be passeddirectly toAxis.set_major_formatter orAxis.set_minor_formatter. An appropriateStrMethodFormatter willbe created and used automatically.
pyplot.grid changes the grid settings of the major ticks of the x- andy-axis together. If you want to control the grid of the minor ticks for agiven axis, use for example
ax.xaxis.grid(True,which='minor')
Note that a given locator or formatter instance can only be used on a singleaxis (because the locator stores references to the axis data and view limits).
importmatplotlib.pyplotaspltimportnumpyasnpfrommatplotlib.tickerimportAutoMinorLocator,MultipleLocatort=np.arange(0.0,100.0,0.1)s=np.sin(0.1*np.pi*t)*np.exp(-t*0.01)fig,ax=plt.subplots()ax.plot(t,s)# Make a plot with major ticks that are multiples of 20 and minor ticks that# are multiples of 5. Label major ticks with '.0f' formatting but don't label# minor ticks. The string is used directly, the `StrMethodFormatter` is# created automatically.ax.xaxis.set_major_locator(MultipleLocator(20))ax.xaxis.set_major_formatter('{x:.0f}')# For the minor ticks, use no labels; default NullFormatter.ax.xaxis.set_minor_locator(MultipleLocator(5))plt.show()
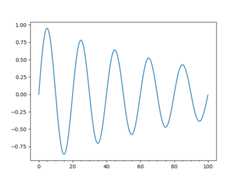
Automatic tick selection for major and minor ticks.
Use interactive pan and zoom to see how the tick intervals change. There willbe either 4 or 5 minor tick intervals per major interval, depending on themajor interval.
One can supply an argument toAutoMinorLocator to specify a fixed numberof minor intervals per major interval, e.g.AutoMinorLocator(2) wouldlead to a single minor tick between major ticks.
t=np.arange(0.0,100.0,0.01)s=np.sin(2*np.pi*t)*np.exp(-t*0.01)fig,ax=plt.subplots()ax.plot(t,s)ax.xaxis.set_minor_locator(AutoMinorLocator())ax.tick_params(which='both',width=2)ax.tick_params(which='major',length=7)ax.tick_params(which='minor',length=4,color='r')plt.show()

References
The use of the following functions, methods, classes and modules is shownin this example:
Total running time of the script: (0 minutes 1.450 seconds)