

Note
Go to the endto download the full example code.
The default tick formatter#
By default, tick labels are formatted using aScalarFormatter, which can beconfigured viaticklabel_format. This example illustrates somepossible configurations:
Default.
useMathText=True: Fancy formatting of mathematical expressions.useOffset=False: Do not use offset notation; seeScalarFormatter.set_useOffset.
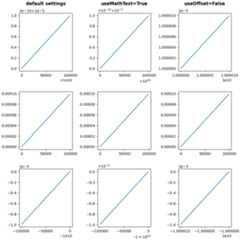
importmatplotlib.pyplotaspltimportnumpyasnpx=np.arange(0,1,.01)fig,axs=plt.subplots(3,3,figsize=(9,9),layout="constrained",gridspec_kw={"hspace":0.1})forcolinaxs.T:col[0].plot(x*1e5+1e10,x*1e-10+1e-5)col[1].plot(x*1e5,x*1e-4)col[2].plot(-x*1e5-1e10,-x*1e-5-1e-10)foraxinaxs[:,1]:ax.ticklabel_format(useMathText=True)foraxinaxs[:,2]:ax.ticklabel_format(useOffset=False)plt.rcParams.update({"axes.titleweight":"bold","axes.titley":1.1})axs[0,0].set_title("default settings")axs[0,1].set_title("useMathText=True")axs[0,2].set_title("useOffset=False")plt.show()
Total running time of the script: (0 minutes 2.050 seconds)