

Note
Go to the endto download the full example code.
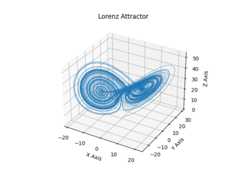
Lorenz attractor#
This is an example of plotting Edward Lorenz's 1963"Deterministic NonperiodicFlow" in a 3-dimensional space using mplot3d.
Note
Because this is a simple non-linear ODE, it would be more easily done usingSciPy's ODE solver, but this approach depends only upon NumPy.
importmatplotlib.pyplotaspltimportnumpyasnpdeflorenz(xyz,*,s=10,r=28,b=2.667):""" Parameters ---------- xyz : array-like, shape (3,) Point of interest in three-dimensional space. s, r, b : float Parameters defining the Lorenz attractor. Returns ------- xyz_dot : array, shape (3,) Values of the Lorenz attractor's partial derivatives at *xyz*. """x,y,z=xyzx_dot=s*(y-x)y_dot=r*x-y-x*zz_dot=x*y-b*zreturnnp.array([x_dot,y_dot,z_dot])dt=0.01num_steps=10000xyzs=np.empty((num_steps+1,3))# Need one more for the initial valuesxyzs[0]=(0.,1.,1.05)# Set initial values# Step through "time", calculating the partial derivatives at the current point# and using them to estimate the next pointforiinrange(num_steps):xyzs[i+1]=xyzs[i]+lorenz(xyzs[i])*dt# Plotax=plt.figure().add_subplot(projection='3d')ax.plot(*xyzs.T,lw=0.5)ax.set_xlabel("X Axis")ax.set_ylabel("Y Axis")ax.set_zlabel("Z Axis")ax.set_title("Lorenz Attractor")plt.show()
Tags:plot-type: 3Dlevel: intermediate