

Note
Go to the endto download the full example code.
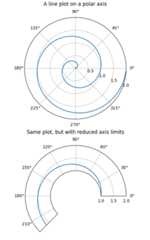
Polar plot#
Demo of a line plot on a polar axis.
The second plot shows the same data, but with the radial axis starting at r=1and the angular axis starting at 0 degrees and ending at 225 degrees. Settingthe origin of the radial axis to 0 allows the radial ticks to be placed at thesame location as the first plot.
importmatplotlib.pyplotaspltimportnumpyasnpr=np.arange(0,2,0.01)theta=2*np.pi*rfig,axs=plt.subplots(2,1,figsize=(5,8),subplot_kw={'projection':'polar'},layout='constrained')ax=axs[0]ax.plot(theta,r)ax.set_rmax(2)ax.set_rticks([0.5,1,1.5,2])# Fewer radial ticksax.set_rlabel_position(-22.5)# Move radial labels away from plotted lineax.grid(True)ax.set_title("A line plot on a polar axis",va='bottom')ax=axs[1]ax.plot(theta,r)ax.set_rmax(2)ax.set_rmin(1)# Change the radial axis to only go from 1 to 2ax.set_rorigin(0)# Set the origin of the radial axis to 0ax.set_thetamin(0)ax.set_thetamax(225)ax.set_rticks([1,1.5,2])# Fewer radial ticksax.set_rlabel_position(-22.5)# Move radial labels away from plotted lineax.grid(True)ax.set_title("Same plot, but with reduced axis limits",va='bottom')plt.show()
References
The use of the following functions, methods, classes and modules is shownin this example:
Tags:plot-type: polarlevel: beginner
Total running time of the script: (0 minutes 1.173 seconds)