

Note
Go to the endto download the full example code.
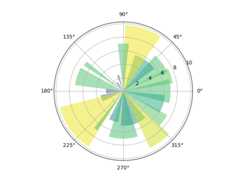
Bar chart on polar axis#
Demo of bar plot on a polar axis.
importmatplotlib.pyplotaspltimportnumpyasnp# Fixing random state for reproducibilitynp.random.seed(19680801)# Compute pie slicesN=20theta=np.linspace(0.0,2*np.pi,N,endpoint=False)radii=10*np.random.rand(N)width=np.pi/4*np.random.rand(N)colors=plt.colormaps["viridis"](radii/10.)ax=plt.subplot(projection='polar')ax.bar(theta,radii,width=width,bottom=0.0,color=colors,alpha=0.5)plt.show()
References
The use of the following functions, methods, classes and modules is shownin this example:
Tags:plot-type: pieplot-type: barlevel: beginnerpurpose: showcase