

Note
Go to the endto download the full example code.
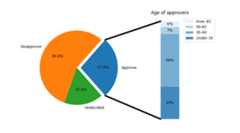
Bar of pie#
Make a "bar of pie" chart where the first slice of the pie is"exploded" into a bar chart with a further breakdown of said slice'scharacteristics. The example demonstrates using a figure with multiplesets of Axes and using the Axes patches list to add two ConnectionPatchesto link the subplot charts.
importmatplotlib.pyplotaspltimportnumpyasnpfrommatplotlib.patchesimportConnectionPatch# make figure and assign axis objectsfig,(ax1,ax2)=plt.subplots(1,2,figsize=(9,5))fig.subplots_adjust(wspace=0)# pie chart parametersoverall_ratios=[.27,.56,.17]labels=['Approve','Disapprove','Undecided']explode=[0.1,0,0]# rotate so that first wedge is split by the x-axisangle=-180*overall_ratios[0]pie=ax1.pie(overall_ratios,autopct='%1.1f%%',startangle=angle,labels=labels,explode=explode)# bar chart parametersage_ratios=[.33,.54,.07,.06]age_labels=['Under 35','35-49','50-65','Over 65']bottom=1width=.2# Adding from the top matches the legend.forj,(height,label)inenumerate(reversed([*zip(age_ratios,age_labels)])):bottom-=heightbc=ax2.bar(0,height,width,bottom=bottom,color='C0',label=label,alpha=0.1+0.25*j)ax2.bar_label(bc,labels=[f"{height:.0%}"],label_type='center')ax2.set_title('Age of approvers')ax2.legend()ax2.axis('off')ax2.set_xlim(-2.5*width,2.5*width)# use ConnectionPatch to draw lines between the two plotstheta1,theta2=pie.wedges[0].theta1,pie.wedges[0].theta2center,r=pie.wedges[0].center,pie.wedges[0].rbar_height=sum(age_ratios)# draw top connecting linex=r*np.cos(np.pi/180*theta2)+center[0]y=r*np.sin(np.pi/180*theta2)+center[1]con=ConnectionPatch(xyA=(-width/2,bar_height),coordsA=ax2.transData,xyB=(x,y),coordsB=ax1.transData)con.set_color([0,0,0])con.set_linewidth(4)ax2.add_artist(con)# draw bottom connecting linex=r*np.cos(np.pi/180*theta1)+center[0]y=r*np.sin(np.pi/180*theta1)+center[1]con=ConnectionPatch(xyA=(-width/2,0),coordsA=ax2.transData,xyB=(x,y),coordsB=ax1.transData)con.set_color([0,0,0])ax2.add_artist(con)con.set_linewidth(4)plt.show()
References
The use of the following functions, methods, classes and modules is shownin this example:
Tags:component: subplotplot-type: pieplot-type: barlevel: intermediatepurpose: showcase