

Note
Go to the endto download the full example code.
Zorder Demo#
The drawing order of artists is determined by theirzorder attribute, whichis a floating point number. Artists with higherzorder are drawn on top.You can change the order for individual artists by setting theirzorder.The default value depends on the type of the Artist:
Artist | Z-order |
|---|---|
Images ( | 0 |
1 | |
| 2 |
Major ticks | 2.01 |
| 3 |
5 |
Any call to a plotting method can set a value for the zorder of that particularitem explicitly.
Note
set_axisbelow andrcParams["axes.axisbelow"] (default:'line') are convenient helpersfor setting the zorder of ticks and grid lines.
Drawing is done perAxes at a time. If you have overlapping Axes, allelements of the second Axes are drawn on top of the first Axes, irrespective oftheir relative zorder.
The following example contains aLine2D created byplot()and the dots (aPatchCollection) created byscatter().Hence, by default the dots are below the line (first subplot).In the second subplot, thezorder is set explicitly to move the dotson top of the line.
fig,(ax1,ax2)=plt.subplots(1,2,figsize=(6,3.2))ax1.plot(x,y,'C3',lw=3)ax1.scatter(x,y,s=120)ax1.set_title('Lines on top of dots')ax2.plot(x,y,'C3',lw=3)ax2.scatter(x,y,s=120,zorder=2.5)# move dots on top of lineax2.set_title('Dots on top of lines')plt.tight_layout()

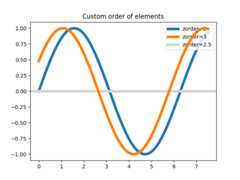
Many functions that create a visible object accepts azorder parameter.Alternatively, you can callset_zorder() on the created object later.
x=np.linspace(0,7.5,100)plt.rcParams['lines.linewidth']=5plt.figure()plt.plot(x,np.sin(x),label='zorder=2',zorder=2)# bottomplt.plot(x,np.sin(x+0.5),label='zorder=3',zorder=3)plt.axhline(0,label='zorder=2.5',color='lightgrey',zorder=2.5)plt.title('Custom order of elements')l=plt.legend(loc='upper right')l.set_zorder(2.5)# legend between blue and orange lineplt.show()
Total running time of the script: (0 minutes 1.036 seconds)